
How Long Will the Global Sell-Off Last?

Yesterday, U.S. stocks delivered a brutal reversal.
The Nasdaq opened about 2% higher and finished roughly 2% lower. The S&P opened up around 1% and closed down about 1%.
The last session I remember looking like this was around Nvidia’s earnings last November.
This time, it was ANT’s market debut.
All eleven S&P sectors closed in the red. The VIX climbed toward 30. CNN’s Fear & Greed Index sank to 19—extreme fear. Across the S&P, 464 stocks fell and just 38 rose.
The panic is here. So where does the selling stop?
Where’s the Floor?
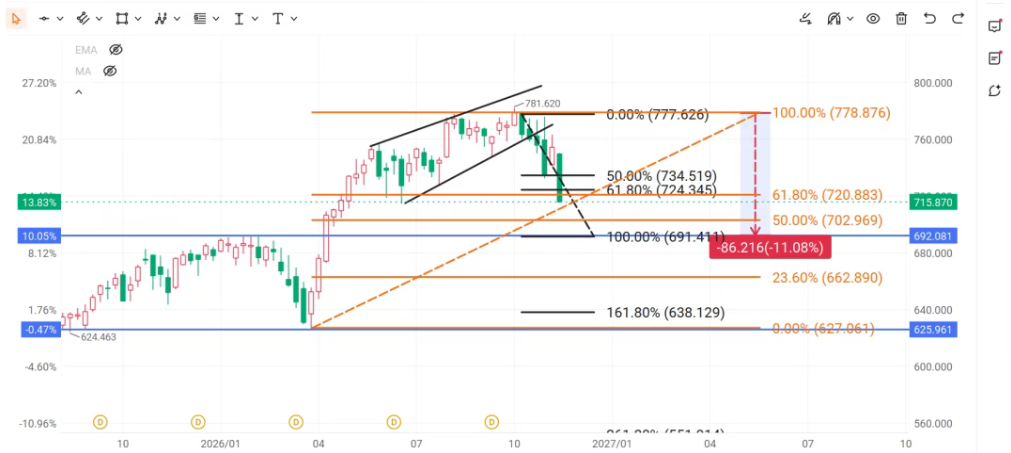
The warning came well before yesterday. The rising wedge near the highs had already broken down.
There were signs of stabilization, but the gap higher was sold almost immediately. Buyers barely had time to get comfortable.
Once the wedge breaks, the measured move gives us a downside target. On the S&P-linked chart below, that points toward 690.
The nearby 690–703 zone is where several levels come together: the measured-move target, the 50% Fibonacci retracement near 703, and the area around last year’s highs and the fair value gap.
That’s the zone I’m watching for the selling to start running out of steam.
What 2022 Can Tell Us
It’s worth going back to the 2022 bear market. The Fed hiked seven times that year, and stocks kept getting hit. The bottom took time.
On the weekly chart, the decline retraced roughly half of the preceding advance and reached about twice the initial measured move.
The sell-off was approximately 27% on this chart. Getting back up was no straight line either.
The first reversal failed. Price retu…