載入中

NYSEEnergyOil & Gas Refining & Marketing
最新資料
US$458.81
+US$3.78 · +0.83%
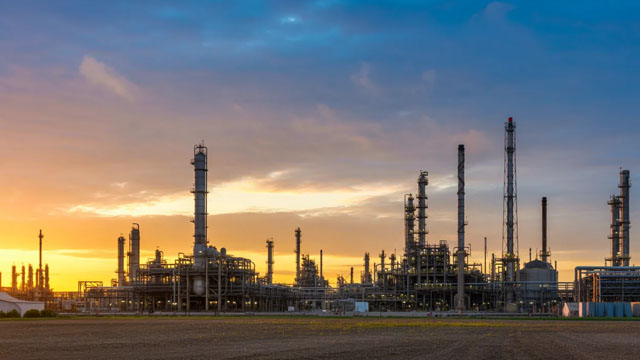
Marathon Petroleum Corporation (MPC) functions as a prominent integrated energy enterprise, primarily concentrating its downstream operations across the United States. Its business is bifurcated into two main divisions: Refining & Marketing, and Midstream. The Refining & Marketing segment is responsible for processing crude oil and various other raw materials at its refineries, strategically located in the U.S. Gulf Coast, Mid-Continent, and West Coast regions. This division also acquires refined petroleum products and ethanol for subsequent distribution. Key outputs from this segment encompass a diverse array of transportation fuels, including different gasoline blends, heavy fuel oil, and asphalt. Additionally, it manufactures chemicals such as aromatics, propane, propylene, and sulfur. MPC sells these refined goods through multiple channels, including wholesale marketers domestically and globally, purchasers on the open spot market, and independent entrepreneurs who manage primarily Marathon-branded retail locations. It also supplies fuel via long-term agreements to direct dealer sites, predominantly under the ARCO brand. The Midstream segment handles the comprehensive movement, storage, distribution, and commercialization of crude oil and refined products. This is achieved through its extensive network of refining logistics assets, pipelines, terminals, towboats, and barges. Moreover, this segment engages in the collection, processing, and transportation of natural gas, alongside the gathering, transport, fractionation, storage, and marketing of natural gas liquids. By December 31, 2021, the corporation supported 7,159 branded jobber retail points, managed by independent entrepreneurs, spanning 37 U.S. states, the District of Columbia, and Mexico. Marathon Petroleum Corporation, established in 1887, maintains its corporate headquarters in Findlay, Ohio.
前收盤價
US$458.81
+US$3.78 · +0.83%
盤前
US$460.71
+US$1.90 · +0.41%
10月13日 上午9:01 ET
盤中時間採用ET。市場資料可能有所延遲。
Marathon Petroleum Corporation (MPC) functions as a prominent integrated energy enterprise, primarily concentrating its downstream operations across the United States. Its business is bifurcated into two main divisions: Refining & Marketing, and Midstream. The Refining & Marketing segment is responsible for processing crude oil and various other raw materials at its refineries, strategically located in the U.S. Gulf Coast, Mid-Continent, and West Coast regions. This division also acquires refined petroleum products and ethanol for subsequent distribution. Key outputs from this segment encompass a diverse array of transportation fuels, including different gasoline blends, heavy fuel oil, and asphalt. Additionally, it manufactures chemicals such as aromatics, propane, propylene, and sulfur. MPC sells these refined goods through multiple channels, including wholesale marketers domestically and globally, purchasers on the open spot market, and independent entrepreneurs who manage primarily Marathon-branded retail locations. It also supplies fuel via long-term agreements to direct dealer sites, predominantly under the ARCO brand. The Midstream segment handles the comprehensive movement, storage, distribution, and commercialization of crude oil and refined products. This is achieved through its extensive network of refining logistics assets, pipelines, terminals, towboats, and barges. Moreover, this segment engages in the collection, processing, and transportation of natural gas, alongside the gathering, transport, fractionation, storage, and marketing of natural gas liquids. By December 31, 2021, the corporation supported 7,159 branded jobber retail points, managed by independent entrepreneurs, spanning 37 U.S. states, the District of Columbia, and Mexico. Marathon Petroleum Corporation, established in 1887, maintains its corporate headquarters in Findlay, Ohio.
日內區間
目前US$458.81
52週區間
目前US$458.81
盤中時間採用ET。市場資料可能有所延遲。
Marathon Petroleum Corporation (MPC) functions as a prominent integrated energy enterprise, primarily concentrating its downstream operations across the United States. Its business is bifurcated into two main divisions: Refining & Marketing, and Midstream. The Refining & Marketing segment is responsible for processing crude oil and various other raw materials at its refineries, strategically located in the U.S. Gulf Coast, Mid-Continent, and West Coast regions. This division also acquires refined petroleum products and ethanol for subsequent distribution. Key outputs from this segment encompass a diverse array of transportation fuels, including different gasoline blends, heavy fuel oil, and asphalt. Additionally, it manufactures chemicals such as aromatics, propane, propylene, and sulfur. MPC sells these refined goods through multiple channels, including wholesale marketers domestically and globally, purchasers on the open spot market, and independent entrepreneurs who manage primarily Marathon-branded retail locations. It also supplies fuel via long-term agreements to direct dealer sites, predominantly under the ARCO brand. The Midstream segment handles the comprehensive movement, storage, distribution, and commercialization of crude oil and refined products. This is achieved through its extensive network of refining logistics assets, pipelines, terminals, towboats, and barges. Moreover, this segment engages in the collection, processing, and transportation of natural gas, alongside the gathering, transport, fractionation, storage, and marketing of natural gas liquids. By December 31, 2021, the corporation supported 7,159 branded jobber retail points, managed by independent entrepreneurs, spanning 37 U.S. states, the District of Columbia, and Mexico. Marathon Petroleum Corporation, established in 1887, maintains its corporate headquarters in Findlay, Ohio.
日內區間
目前US$458.81
52週區間
目前US$458.81
獲利能力占已公布營收的百分比。
營收
營業利益
淨利
| 項目(USD) | 2025會計年度 | 2024會計年度 | 2023會計年度 | 2022會計年度 | 2021會計年度 |
|---|---|---|---|---|---|
| 營收 | 1326.99億 USD | 1388.64億 USD | 1483.79億 USD | 1774.53億 USD | 1199.83億 USD |
| 銷貨成本 | 1226.97億 USD | 1295.77億 USD | 1318.73億 USD | 1548.86億 USD | 1133.72億 USD |
| 毛利 | 100.02億 USD | 92.87億 USD | 165.06億 USD | 225.67億 USD | 66.11億 USD |
| 銷售、一般及管理費用 | 33.49億 USD | 32.21億 USD | 30.39億 USD | 27.72億 USD | 25.37億 USD |
| 營業費用 | 42.34億 USD | 40.39億 USD | 39.2億 USD | 35.97億 USD | 23.11億 USD |
| 利息收入 | 1.59億 USD | 4.67億 USD | 6.72億 USD | 2.21億 USD | 1400萬 USD |
| 利息支出 | 14.12億 USD | 13.44億 USD | 12.77億 USD | 12.16億 USD | 13億 USD |
| 折舊和攤銷 | 32.51億 USD | 33.37億 USD | 33.07億 USD | 32.15億 USD | 33.64億 USD |
| 營業利益 | 57.68億 USD | 52.48億 USD | 125.86億 USD | 189.7億 USD | 43億 USD |
| 淨利 | 40.47億 USD | 34.45億 USD | 96.81億 USD | 145.16億 USD | 97.38億 USD |
公司資料更新於 2026年10月13日。
近期已公布業績
近期已公布業績
第三方分析師預期可能變動,並非 GoAI 建議。
平均目標
US$428.3
下跌空間 6.65%年度分割調整後的每股現金分配。
US$3.73
2025年(完整年度)+60.8% 自從 2021
2026年(部分年度):US$3.00
US$2.32
2,021
US$2.49
2,022
US$3.075
2,023
US$3.385
2,024
US$3.73
2,025
US$3.00
2,026*
* 在現有股息歷史記錄中,該日曆年僅包含部分期間。
| 行動 | 除息日 | 詳情 | 記錄日期 | 付款日期 |
|---|---|---|---|---|
股息 | 2026年8月19日 | US$1.00Quarterly | 2026年8月19日 | 2026年9月10日 |
股息 | 2026年5月20日 | US$1.00Quarterly | 2026年5月20日 | 2026年6月10日 |
股息 | 2026年2月18日 | US$1.00Quarterly | 2026年2月18日 | 2026年3月10日 |
股息 | 2025年11月19日 | US$1.00Quarterly | 2025年11月19日 | 2025年12月10日 |
股息 | 2025年8月20日 | US$0.91Quarterly | 2025年8月20日 | 2025年9月10日 |
股息 | 2025年5月21日 | US$0.91Quarterly | 2025年5月21日 | 2025年6月10日 |
除息 2026年8月19日
US$1.00
Quarterly
2026年8月19日登記 · 支付日 2026年9月10日
除息 2026年5月20日
US$1.00
Quarterly
2026年5月20日登記 · 支付日 2026年6月10日
除息 2026年2月18日
US$1.00
Quarterly
2026年2月18日登記 · 支付日 2026年3月10日
除息 2025年11月19日
US$1.00
Quarterly
2025年11月19日登記 · 支付日 2025年12月10日
除息 2025年8月20日
US$0.91
Quarterly
2025年8月20日登記 · 支付日 2025年9月10日
除息 2025年5月21日
US$0.91
Quarterly
2025年5月21日登記 · 支付日 2025年6月10日
報告持有此股票曝險的交易所交易基金。
 State Street SPDR S&P 500 ETF1557.T2458.42億0.19%130.34兆 JPY0.09%¥122,950+0.08%
 Vanguard Morningstar Total Stock Market ETFVTI34.63億0.15%2.3兆 USD0.03%US$381.57-0.10%
 Vanguard S&P 500 ETFVOO28.95億0.16%1.8兆 USD0.03%US$715.13-0.06%
 Vanguard Morningstar Mid-Cap ETFVO23.57億1.04%2264億 USD0.03%US$80.92-0.27%
 State Street Energy Select Sector SPDR ETFXLE21.45億5.11%423.54億 USD0.08%US$66.01+1.43%
 iShares Core S&P 500 ETFIVV17億0.19%8964.4億 USD0.03%US$781.44-0.07%
 State Street SPDR S&P 500 ETFSPY15.49億0.19%8216.79億 USD0.09%US$778.1-0.06%
 Vanguard Morningstar Value ETFVTV10.42億0.40%2624億 USD0.03%US$221.43+0.38%State Street SPDR S&P 500 ETF1557.TVanguard Morningstar Total Stock Market ETFVTIVanguard S&P 500 ETFVOOVanguard Morningstar Mid-Cap ETFVOState Street Energy Select Sector SPDR ETFXLEiShares Core S&P 500 ETFIVVState Street SPDR S&P 500 ETFSPYVanguard Morningstar Value ETFVTV
AI 生成內容及延遲市場資料僅供資訊與教育用途,不構成投資建議。