กำลังโหลด
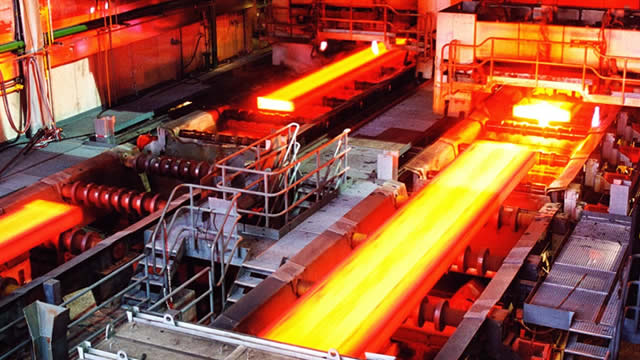
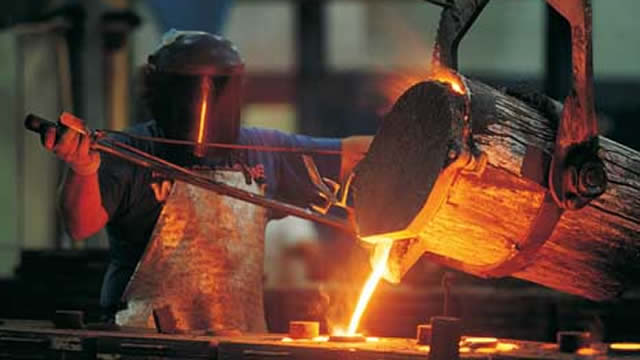
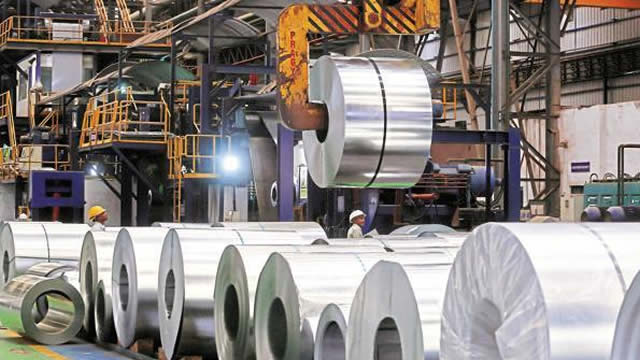
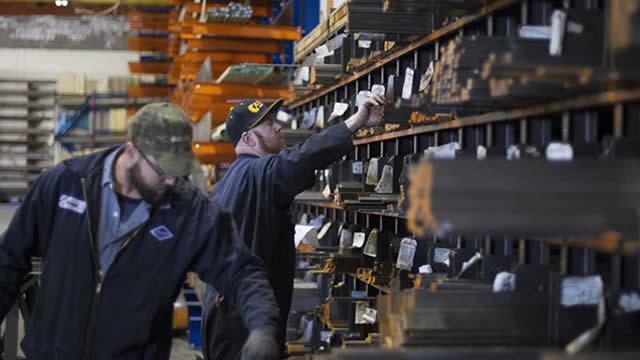
Nucor Corporation is a prominent producer and distributor of steel and diverse steel-related products. Within its Steel Mills division, the company manufactures a comprehensive range of steel goods. These include various sheet steel types like hot-rolled, cold-rolled, and galvanized, alongside plate steel. It also produces structural components such as wide-flange beams, beam blanks, H-piling, and sheet piling. Furthermore, this segment supplies bar steel products, encompassing blooms, billets, concrete reinforcing bars, merchant bars, and specialized bar quality items. Beyond manufacturing, Nucor's steel mills are involved in steel trading and the distribution of rebar. Its clientele primarily consists of steel service centers, fabricators, and manufacturers across the United States, Canada, and Mexico. The Steel Products segment provides an array of manufactured steel goods, such as hollow structural section tubing, electrical conduits, steel racking, joists and girders, steel decks, and fabricated concrete reinforcing steel. It also supplies cold finished steel, fasteners, complete metal building systems, insulated metal panels, steel grating, expanded metal, and various wire and wire mesh products. These offerings are largely directed towards nonresidential construction projects. Additionally, this segment manages a piling distribution operation. Nucor's Raw Materials division is responsible for producing direct reduced iron (DRI). It also acts as a broker for ferrous and nonferrous metals, pig iron, hot briquetted iron (HBI), and direct reduced iron (DRI). This segment supplies ferro-alloys, processes both ferrous and nonferrous scrap metals, and undertakes natural gas drilling activities. Its ferrous scrap is supplied to electric arc furnace steel mills and foundries for their manufacturing processes. Meanwhile, nonferrous scrap metal is sold to aluminum can manufacturers, secondary aluminum smelters, steel mills, various other processors, and direct consumers of diverse nonferrous metals. The corporation caters to a wide range of industries including agriculture, automotive, construction, energy and transmission, oil and gas, heavy equipment, infrastructure, and transportation. Sales are conducted via an in-house sales team and through the company's internal distribution and trading enterprises. Established in 1958, Nucor Corporation has its headquarters situated in Charlotte, North Carolina.
ราคาปิดก่อนหน้า
US$250.33
+US$4.19 · +1.70%
เวลาในวันใช้เขตเวลาET ข้อมูลตลาดอาจล่าช้า
คะแนน GoAI
ถือ
มูลค่า
76
ต่ำกว่ามูลค่า
ความเชื่อมั่น
71
เชิงบวก
ความเสี่ยง
43
ความเสี่ยงค่อนข้างสูง
โมเมนตัม
47
เป็นกลาง
งานวิจัย GoAI ฉบับเต็ม
ดูข้อมูลสนับสนุน ปัจจัยหนุน และความเสี่ยงในเชิงลึก
Nucor Corporation is a prominent producer and distributor of steel and diverse steel-related products. Within its Steel Mills division, the company manufactures a comprehensive range of steel goods. These include various sheet steel types like hot-rolled, cold-rolled, and galvanized, alongside plate steel. It also produces structural components such as wide-flange beams, beam blanks, H-piling, and sheet piling. Furthermore, this segment supplies bar steel products, encompassing blooms, billets, concrete reinforcing bars, merchant bars, and specialized bar quality items. Beyond manufacturing, Nucor's steel mills are involved in steel trading and the distribution of rebar. Its clientele primarily consists of steel service centers, fabricators, and manufacturers across the United States, Canada, and Mexico. The Steel Products segment provides an array of manufactured steel goods, such as hollow structural section tubing, electrical conduits, steel racking, joists and girders, steel decks, and fabricated concrete reinforcing steel. It also supplies cold finished steel, fasteners, complete metal building systems, insulated metal panels, steel grating, expanded metal, and various wire and wire mesh products. These offerings are largely directed towards nonresidential construction projects. Additionally, this segment manages a piling distribution operation. Nucor's Raw Materials division is responsible for producing direct reduced iron (DRI). It also acts as a broker for ferrous and nonferrous metals, pig iron, hot briquetted iron (HBI), and direct reduced iron (DRI). This segment supplies ferro-alloys, processes both ferrous and nonferrous scrap metals, and undertakes natural gas drilling activities. Its ferrous scrap is supplied to electric arc furnace steel mills and foundries for their manufacturing processes. Meanwhile, nonferrous scrap metal is sold to aluminum can manufacturers, secondary aluminum smelters, steel mills, various other processors, and direct consumers of diverse nonferrous metals. The corporation caters to a wide range of industries including agriculture, automotive, construction, energy and transmission, oil and gas, heavy equipment, infrastructure, and transportation. Sales are conducted via an in-house sales team and through the company's internal distribution and trading enterprises. Established in 1958, Nucor Corporation has its headquarters situated in Charlotte, North Carolina.
ช่วงราคารายวัน
ปัจจุบัน US$250.33
ช่วง 52 สัปดาห์
ปัจจุบัน US$250.33
อัตรากำไรที่รายงานในช่วงเวลาที่มีอยู่
รายได้
รายได้จากการดำเนินงาน
รายได้สุทธิ
| รายการ (USD) | ปีงบประมาณ 2025 | ปีงบประมาณ 2024 | ปีงบประมาณ 2023 | ปีงบประมาณ 2022 | ปีงบประมาณ 2021 |
|---|---|---|---|---|---|
| รายได้ | 32.49B USD | 30.73B USD | 34.71B USD | 41.51B USD | 36.48B USD |
| ต้นทุนสินค้าขาย | 28.62B USD | 26.63B USD | 26.9B USD | 29.01B USD | 25.46B USD |
| กำไรขั้นต้น | 3.88B USD | 4.1B USD | 7.82B USD | 12.5B USD | 11.03B USD |
| การขาย ทั่วไป และธุรการ | 1.22B USD | 1.12B USD | 1.59B USD | 2B USD | 1.71B USD |
| ค่าใช้จ่ายในการดำเนินงาน | 1.22B USD | 1.12B USD | 1.59B USD | 2B USD | 1.71B USD |
| รายได้ดอกเบี้ย | 111M USD | 258M USD | 276M USD | 48.7M USD | 4.27M USD |
| ดอกเบี้ยจ่าย | 170M USD | 228M USD | 246M USD | 218.91M USD | 163.12M USD |
| ค่าเสื่อมราคาและค่าตัดจำหน่าย | 1.48B USD | 1.36B USD | 1.17B USD | 1.06B USD | 864.56M USD |
| รายได้จากการดำเนินงาน | 2.66B USD | 2.98B USD | 6.23B USD | 10.51B USD | 9.32B USD |
| รายได้สุทธิ | 1.74B USD | 2.03B USD | 4.52B USD | 7.61B USD | 6.83B USD |
ข้อเท็จจริงของบริษัทได้รับการปรับปรุง 11 ต.ค. 2569.
ผลประกอบการล่าสุดที่ประกาศ
ผลประกอบการล่าสุดที่ประกาศ
ประมาณการของนักวิเคราะห์ภายนอกอาจเปลี่ยนแปลงและไม่ใช่คำแนะนำของ GoAI
เป้าหมายเฉลี่ย
US$266.88
โอกาสปรับขึ้น 6.61%การกระจายเงินสดแบบแยกส่วนประจำปีต่อหุ้น
US$2.21
2025 ทั้งปี+28.9% เนื่องจาก 2021
2026 บางส่วนของปี: US$1.68
US$1.715
2,021
US$2.01
2,022
US$2.07
2,023
US$2.17
2,024
US$2.21
2,025
US$1.68
2,026*
* ปีปฏิทินดังกล่าวมีข้อมูลเพียงบางส่วนในประวัติเงินปันผลที่มีอยู่
| รายการ | วันจ่ายเงินปันผล | รายละเอียด | วันกำหนดรายชื่อ | วันจ่ายเงิน |
|---|---|---|---|---|
เงินปันผล | 30 ก.ย. 2569 | US$0.56Quarterly | 30 ก.ย. 2569 | 10 พ.ย. 2569 |
เงินปันผล | 30 มิ.ย. 2569 | US$0.56Quarterly | 30 มิ.ย. 2569 | 11 ส.ค. 2569 |
เงินปันผล | 31 มี.ค. 2569 | US$0.56Quarterly | 31 มี.ค. 2569 | 11 พ.ค. 2569 |
เงินปันผล | 31 ธ.ค. 2568 | US$0.56Quarterly | 31 ธ.ค. 2568 | 11 ก.พ. 2569 |
เงินปันผล | 30 ก.ย. 2568 | US$0.55Quarterly | 30 ก.ย. 2568 | 10 พ.ย. 2568 |
เงินปันผล | 30 มิ.ย. 2568 | US$0.55Quarterly | 30 มิ.ย. 2568 | 11 ส.ค. 2568 |
ขึ้นเครื่องหมาย XD 30 ก.ย. 2569
US$0.56
Quarterly
วันกำหนดรายชื่อ 30 ก.ย. 2569 · วันจ่ายเงิน 10 พ.ย. 2569
ขึ้นเครื่องหมาย XD 30 มิ.ย. 2569
US$0.56
Quarterly
วันกำหนดรายชื่อ 30 มิ.ย. 2569 · วันจ่ายเงิน 11 ส.ค. 2569
ขึ้นเครื่องหมาย XD 31 มี.ค. 2569
US$0.56
Quarterly
วันกำหนดรายชื่อ 31 มี.ค. 2569 · วันจ่ายเงิน 11 พ.ค. 2569
ขึ้นเครื่องหมาย XD 31 ธ.ค. 2568
US$0.56
Quarterly
วันกำหนดรายชื่อ 31 ธ.ค. 2568 · วันจ่ายเงิน 11 ก.พ. 2569
ขึ้นเครื่องหมาย XD 30 ก.ย. 2568
US$0.55
Quarterly
วันกำหนดรายชื่อ 30 ก.ย. 2568 · วันจ่ายเงิน 10 พ.ย. 2568
ขึ้นเครื่องหมาย XD 30 มิ.ย. 2568
US$0.55
Quarterly
วันกำหนดรายชื่อ 30 มิ.ย. 2568 · วันจ่ายเงิน 11 ส.ค. 2568
กองทุนซื้อขายแลกเปลี่ยนที่รายงานความเสี่ยงต่อหุ้นนี้
 State Street SPDR S&P 500 ETF1557.T107.67B0.08%129.35T JPY0.09%¥122,850+0.12%
 Vanguard Morningstar Total Stock Market ETFVTI1.81B0.08%2.3T USD0.03%US$381.94+0.63%
 Vanguard S&P 500 ETFVOO1.51B0.09%1.8T USD0.03%US$715.59+0.61%
 Vanguard Morningstar Mid-Cap ETFVO1.23B0.54%226.4B USD0.03%US$81.14+0.92%
 iShares Core S&P 500 ETFIVV742.45M0.08%896.44B USD0.03%US$781.97+0.60%
 State Street SPDR S&P 500 ETFSPY680.22M0.08%817.2B USD0.09%US$778.57+0.60%
 Vanguard Morningstar Value ETFVTV543.12M0.21%262.4B USD0.03%US$220.59+0.44%
 Global X - U.S. Infrastructure Development ETFPAVE457.82M3.35%13.67B USD0.47%US$53.45+0.38%State Street SPDR S&P 500 ETF1557.TVanguard Morningstar Total Stock Market ETFVTIVanguard S&P 500 ETFVOOVanguard Morningstar Mid-Cap ETFVOiShares Core S&P 500 ETFIVVState Street SPDR S&P 500 ETFSPYVanguard Morningstar Value ETFVTVGlobal X - U.S. Infrastructure Development ETFPAVE
เนื้อหาที่สร้างโดย AI และข้อมูลตลาดที่ล่าช้ามีไว้เพื่อให้ข้อมูลและการศึกษาเท่านั้น ไม่ใช่คำแนะนำการลงทุน