加载中

AMEXBasic MaterialsIndustrial Materials
最新数据
US$2.055
−US$0.125 · -5.73%
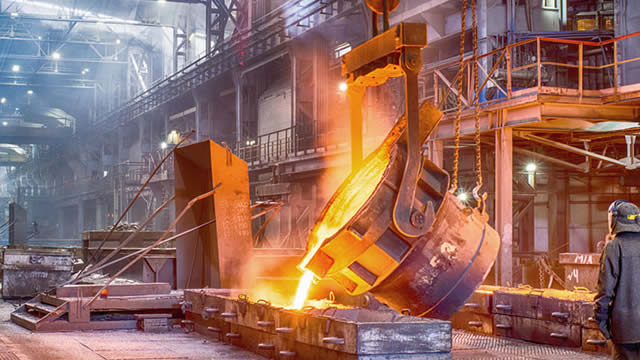
Titan Mining Corporation functions as a natural resources enterprise, engaging in the acquisition, exploration, development, production, and extraction of mineral properties. Its exploratory efforts are primarily aimed at discovering deposits of zinc, graphite, and iron-oxide copper gold. The company's principal holding is the Empire State Mine project, an extensive site spanning approximately 80,000 acres located within northern New York's Balmat-Edwards mining district. Established in 2012 as Triton Mining Corporation, the entity officially adopted the name Titan Mining Corporation in November 2016 and maintains its corporate headquarters in Vancouver, Canada.
常规交易时段
US$2.055
−US$0.125 · -5.73%
盘中时间采用ET。市场数据可能有所延迟。
Titan Mining Corporation functions as a natural resources enterprise, engaging in the acquisition, exploration, development, production, and extraction of mineral properties. Its exploratory efforts are primarily aimed at discovering deposits of zinc, graphite, and iron-oxide copper gold. The company's principal holding is the Empire State Mine project, an extensive site spanning approximately 80,000 acres located within northern New York's Balmat-Edwards mining district. Established in 2012 as Triton Mining Corporation, the entity officially adopted the name Titan Mining Corporation in November 2016 and maintains its corporate headquarters in Vancouver, Canada.
日内区间
当前US$2.055
52周区间
当前US$2.055
盘中时间采用ET。市场数据可能有所延迟。
Titan Mining Corporation functions as a natural resources enterprise, engaging in the acquisition, exploration, development, production, and extraction of mineral properties. Its exploratory efforts are primarily aimed at discovering deposits of zinc, graphite, and iron-oxide copper gold. The company's principal holding is the Empire State Mine project, an extensive site spanning approximately 80,000 acres located within northern New York's Balmat-Edwards mining district. Established in 2012 as Triton Mining Corporation, the entity officially adopted the name Titan Mining Corporation in November 2016 and maintains its corporate headquarters in Vancouver, Canada.
日内区间
当前US$2.055
52周区间
当前US$2.055
盈利能力占已公布营收的百分比。
营收
营业利润
净利润
| 项目(USD) | 2025财年 | 2024财年 | 2023财年 | 2022财年 | 2021财年 |
|---|---|---|---|---|---|
| 营收 | 7423.6万 USD | 6430.1万 USD | 5208.6万 USD | 6206.1万 USD | 5559.4万 USD |
| 销货成本 | 5856.1万 USD | 5161万 USD | 5974万 USD | 5480.7万 USD | 4631.3万 USD |
| 毛利 | 1567.5万 USD | 1269.1万 USD | −765.4万 USD | 725.4万 USD | 928.1万 USD |
| 销售、一般及管理费用 | 488.8万 USD | 365万 USD | 430.9万 USD | 463.8万 USD | 390.7万 USD |
| 营业费用 | 726.8万 USD | 398.8万 USD | 617.9万 USD | 1031.6万 USD | 767.9万 USD |
| 利息收入 | 32.2万 USD | 31.5万 USD | 23.4万 USD | 15.5万 USD | 5.7万 USD |
| 利息支出 | 248.5万 USD | 402.3万 USD | 415万 USD | 242.9万 USD | 279.2万 USD |
| 折旧和摊销 | 521.3万 USD | 879.5万 USD | 1296.6万 USD | 1233.7万 USD | 1186.3万 USD |
| 营业利润 | 840.7万 USD | 870.3万 USD | −1383.3万 USD | −306.2万 USD | 160.2万 USD |
| 净利润 | −7.6万 USD | 654.7万 USD | −1021万 USD | −94万 USD | 45.4万 USD |
公司数据更新于 2026年10月13日。
近期已公布业绩
近期已公布业绩
第三方分析师预期可能变化,并非 GoAI 建议。
平均目标
US$6.25
上涨空间 204.14%| 行动 | 除息日 | 详情 | 记录日期 | 付款日期 |
|---|---|---|---|---|
股息 | 2023年3月30日 | US$0.0111Irregular | 2023年3月31日 | 2023年4月14日 |
股息 | 2022年12月29日 | US$0.0111Special | 2022年12月13日 | 2023年1月13日 |
股息 | 2022年9月28日 | US$0.011Special | 2022年9月29日 | 2022年10月14日 |
股息 | 2022年6月29日 | US$0.0116Special | 2022年6月30日 | 2022年7月15日 |
股息 | 2022年3月30日 | US$0.012Special | 2022年3月31日 | 2022年4月15日 |
股息 | 2021年12月29日 | US$0.0117Special | 2021年12月30日 | 2022年1月18日 |
除息 2023年3月30日
US$0.0111
Irregular
2023年3月31日登记 · 支付日 2023年4月14日
除息 2022年12月29日
US$0.0111
Special
2022年12月13日登记 · 支付日 2023年1月13日
除息 2022年9月28日
US$0.011
Special
2022年9月29日登记 · 支付日 2022年10月14日
除息 2022年6月29日
US$0.0116
Special
2022年6月30日登记 · 支付日 2022年7月15日
除息 2022年3月30日
US$0.012
Special
2022年3月31日登记 · 支付日 2022年4月15日
除息 2021年12月29日
US$0.0117
Special
2021年12月30日登记 · 支付日 2022年1月18日
报告持有此股票敞口的交易所交易基金。
AI 生成内容及延迟市场数据仅供信息与教育用途,不构成投资建议。