載入中
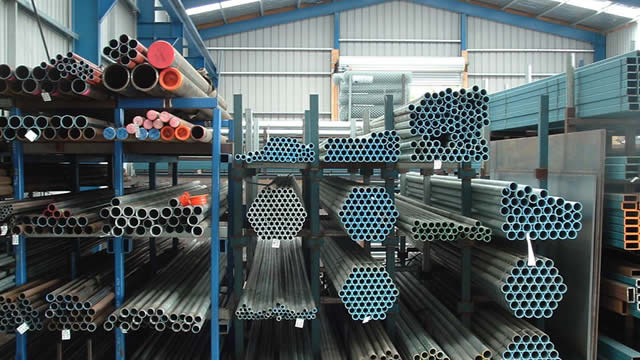
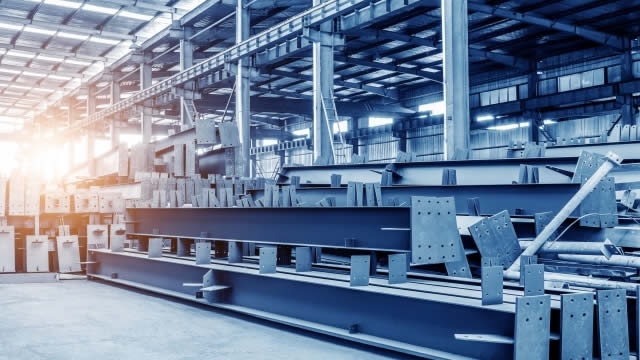
Globally, ATI Inc. stands as a premier manufacturer and supplier of specialized materials and complex components. The enterprise's operations are strategically divided into two primary divisions: High Performance Materials & Components (HPMC) and Advanced Alloys & Solutions (AA&S). The HPMC segment is responsible for creating a diverse range of advanced substances, including titanium and its numerous alloys, nickel- and cobalt-based alloys (such as superalloys), sophisticated powdered alloys, and other distinctive specialty materials. These are offered in elongated product forms like ingots, billets, bars, rods, wires, various structural shapes, rectangular sections, and seamless tubing. Additionally, this division engineers precision forgings, finished components, and custom-machined parts, primarily catering to the aerospace, defense, medical, and energy industries. In contrast, the AA&S segment focuses on producing zirconium and its associated alloys, which include hafnium and niobium, alongside nickel-based alloys, titanium and its specific alloys, and other unique high-performance alloys. These are commonly supplied as plates, sheets, and meticulously rolled strip products. This segment further extends its services to include hot-rolling conversion for materials like carbon steel and titanium products. The offerings from AA&S find critical applications across the energy, aerospace and defense, automotive, and electronics sectors. Formerly known as Allegheny Technologies Incorporated, ATI Inc. was established in 1960 and currently maintains its corporate headquarters in Dallas, Texas.
前收盤價
US$189.19
−US$5.50 · -2.83%
盤前
US$185.81
−US$3.38 · -1.79%
10月8日 上午8:56 ET
盤中時間採用ET。市場資料可能有所延遲。
Globally, ATI Inc. stands as a premier manufacturer and supplier of specialized materials and complex components. The enterprise's operations are strategically divided into two primary divisions: High Performance Materials & Components (HPMC) and Advanced Alloys & Solutions (AA&S). The HPMC segment is responsible for creating a diverse range of advanced substances, including titanium and its numerous alloys, nickel- and cobalt-based alloys (such as superalloys), sophisticated powdered alloys, and other distinctive specialty materials. These are offered in elongated product forms like ingots, billets, bars, rods, wires, various structural shapes, rectangular sections, and seamless tubing. Additionally, this division engineers precision forgings, finished components, and custom-machined parts, primarily catering to the aerospace, defense, medical, and energy industries. In contrast, the AA&S segment focuses on producing zirconium and its associated alloys, which include hafnium and niobium, alongside nickel-based alloys, titanium and its specific alloys, and other unique high-performance alloys. These are commonly supplied as plates, sheets, and meticulously rolled strip products. This segment further extends its services to include hot-rolling conversion for materials like carbon steel and titanium products. The offerings from AA&S find critical applications across the energy, aerospace and defense, automotive, and electronics sectors. Formerly known as Allegheny Technologies Incorporated, ATI Inc. was established in 1960 and currently maintains its corporate headquarters in Dallas, Texas.
日內區間
目前US$189.19
52週區間
目前US$189.19
盤中時間採用ET。市場資料可能有所延遲。
Globally, ATI Inc. stands as a premier manufacturer and supplier of specialized materials and complex components. The enterprise's operations are strategically divided into two primary divisions: High Performance Materials & Components (HPMC) and Advanced Alloys & Solutions (AA&S). The HPMC segment is responsible for creating a diverse range of advanced substances, including titanium and its numerous alloys, nickel- and cobalt-based alloys (such as superalloys), sophisticated powdered alloys, and other distinctive specialty materials. These are offered in elongated product forms like ingots, billets, bars, rods, wires, various structural shapes, rectangular sections, and seamless tubing. Additionally, this division engineers precision forgings, finished components, and custom-machined parts, primarily catering to the aerospace, defense, medical, and energy industries. In contrast, the AA&S segment focuses on producing zirconium and its associated alloys, which include hafnium and niobium, alongside nickel-based alloys, titanium and its specific alloys, and other unique high-performance alloys. These are commonly supplied as plates, sheets, and meticulously rolled strip products. This segment further extends its services to include hot-rolling conversion for materials like carbon steel and titanium products. The offerings from AA&S find critical applications across the energy, aerospace and defense, automotive, and electronics sectors. Formerly known as Allegheny Technologies Incorporated, ATI Inc. was established in 1960 and currently maintains its corporate headquarters in Dallas, Texas.
日內區間
目前US$189.19
52週區間
目前US$189.19
獲利能力占已公布營收的百分比。
營收
營業利益
淨利
| 項目(USD) | 2025會計年度 | 2024會計年度 | 2023會計年度 | 2022會計年度 | 2021會計年度 |
|---|---|---|---|---|---|
| 營收 | 45.87億 USD | 43.62億 USD | 41.74億 USD | 38.36億 USD | 28億 USD |
| 銷貨成本 | 35.88億 USD | 34.49億 USD | 33.47億 USD | 31.22億 USD | 24.66億 USD |
| 毛利 | 10億 USD | 9.14億 USD | 8.26億 USD | 7.14億 USD | 3.34億 USD |
| 研究與開發 | 2130萬 USD | 2210萬 USD | 2210萬 USD | 1770萬 USD | 2000萬 USD |
| 銷售、一般及管理費用 | 3.44億 USD | 3.69億 USD | 4.08億 USD | 1.59億 USD | 3310萬 USD |
| 營業費用 | 3.65億 USD | 3.05億 USD | 3.6億 USD | 3.98億 USD | 2.16億 USD |
| 利息收入 | 1210萬 USD | 1600萬 USD | 1300萬 USD | 470萬 USD | — |
| 利息支出 | 1.11億 USD | 1.24億 USD | 1.06億 USD | 9210萬 USD | 9690萬 USD |
| 折舊和攤銷 | 1.68億 USD | 1.52億 USD | 1.46億 USD | 1.43億 USD | 1.44億 USD |
| 營業利益 | 6.35億 USD | 6.09億 USD | 4.66億 USD | 3.16億 USD | 1.18億 USD |
| 淨利 | 4.04億 USD | 3.68億 USD | 4.11億 USD | 3.24億 USD | 1.85億 USD |
公司資料更新於 2026年10月8日。
近期已公布業績
近期已公布業績
第三方分析師預期可能變動,並非 GoAI 建議。
平均目標
US$242
上漲空間 27.91%| 行動 | 生效日期 | 詳情 | 記錄日期 | 付款日期 |
|---|---|---|---|---|
股票分割 | 1999年11月30日 | 1:2 | — | — |
股票分割 | 1993年7月2日 | 2:1 | — | — |
股票分割 | 1990年7月3日 | 3:2 | — | — |
已生效 1999年11月30日
1:2
已生效 1993年7月2日
2:1
已生效 1990年7月3日
3:2
報告持有此股票曝險的交易所交易基金。
 Vanguard Morningstar Total Stock Market ETFVTI8.85億0.04%2.3兆 USD0.03%US$381.03-0.40%
 Vanguard Morningstar Small-Cap ETFVB6.41億0.34%1853億 USD0.03%US$286.98-1.41%
 Vanguard Morningstar Small-Cap Growth ETFVBK3.68億0.80%447億 USD0.05%US$342.24-1.50%
 Vanguard Extended Market ETFVXF3.24億0.33%954億 USD0.05%US$233.49-1.56%
 iShares Large Cap Core Active ETFBLCR2.98億3.05%97.37億 USD0.38%US$50.24-0.46%
 Invesco S&P MidCap Momentum ETFXMMO2.88億3.97%72.53億 USD0.34%US$148.32-2.25%
 iShares U.S. Aerospace & Defense ETFITA2.49億2.05%121.4億 USD0.37%US$203.6-2.24%
 Global X - U.S. Infrastructure Development ETFPAVE2.19億1.57%139.5億 USD0.47%US$53.29-2.49%Vanguard Morningstar Total Stock Market ETFVTIVanguard Morningstar Small-Cap ETFVBVanguard Morningstar Small-Cap Growth ETFVBKVanguard Extended Market ETFVXFiShares Large Cap Core Active ETFBLCRInvesco S&P MidCap Momentum ETFXMMOiShares U.S. Aerospace & Defense ETFITAGlobal X - U.S. Infrastructure Development ETFPAVE
AI 生成內容及延遲市場資料僅供資訊與教育用途,不構成投資建議。