載入中
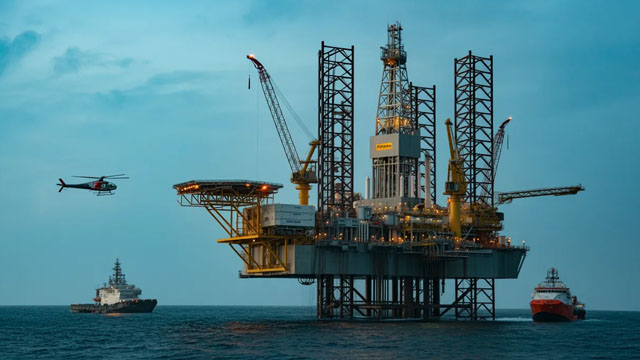
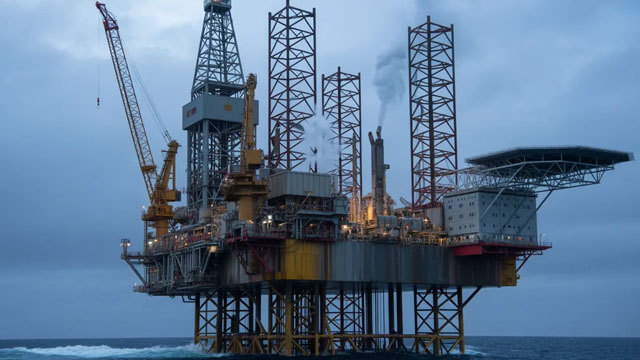
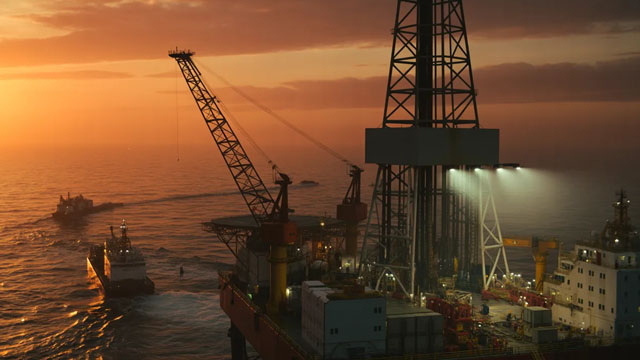
Equinor ASA operates as an energy company in Norway and internationally. It operates through Exploration & Production Norway; Exploration & Production International; Exploration & Production USA; Marketing, Midstream & Processing; and Renewables segments. The company engages in the discovery and appraisal of new resources, as well as commercial development and operation of the oil and gas portfolios; oil and gas field development, well deliveries, and sourcing; research, technology development, specialist advisory services, digitalization, IT, improvement, innovation, and ventures and future business; and developing, exploring, investing in, and operating areas within renewable energy, such as offshore wind, green hydrogen, storage solutions, and solar power. It is also involved in the marketing, trading, processing, and transportation of crude oil and condensate, natural gas, NGL and refined products, including refineries, terminals, and processing plant operation; power and emissions trading; development of transportation solutions for natural gas, liquids, and crude oil, including pipelines, shipping, trucking, and rail; and provision of low carbon solutions. The company was formerly known as Statoil ASA and changed its name to Equinor ASA in May 2018. Equinor ASA was incorporated in 1972 and is headquartered in Stavanger, Norway.
收盤時
US$43.94
+US$0.93 · +2.16%
盤後
US$44.2998
+US$0.3598 · +0.82%
10月12日 下午7:57 ET
盤中時間採用ET。市場資料可能有所延遲。
Equinor ASA operates as an energy company in Norway and internationally. It operates through Exploration & Production Norway; Exploration & Production International; Exploration & Production USA; Marketing, Midstream & Processing; and Renewables segments. The company engages in the discovery and appraisal of new resources, as well as commercial development and operation of the oil and gas portfolios; oil and gas field development, well deliveries, and sourcing; research, technology development, specialist advisory services, digitalization, IT, improvement, innovation, and ventures and future business; and developing, exploring, investing in, and operating areas within renewable energy, such as offshore wind, green hydrogen, storage solutions, and solar power. It is also involved in the marketing, trading, processing, and transportation of crude oil and condensate, natural gas, NGL and refined products, including refineries, terminals, and processing plant operation; power and emissions trading; development of transportation solutions for natural gas, liquids, and crude oil, including pipelines, shipping, trucking, and rail; and provision of low carbon solutions. The company was formerly known as Statoil ASA and changed its name to Equinor ASA in May 2018. Equinor ASA was incorporated in 1972 and is headquartered in Stavanger, Norway.
日內區間
目前US$43.94
52週區間
目前US$43.94
盤中時間採用ET。市場資料可能有所延遲。
Equinor ASA operates as an energy company in Norway and internationally. It operates through Exploration & Production Norway; Exploration & Production International; Exploration & Production USA; Marketing, Midstream & Processing; and Renewables segments. The company engages in the discovery and appraisal of new resources, as well as commercial development and operation of the oil and gas portfolios; oil and gas field development, well deliveries, and sourcing; research, technology development, specialist advisory services, digitalization, IT, improvement, innovation, and ventures and future business; and developing, exploring, investing in, and operating areas within renewable energy, such as offshore wind, green hydrogen, storage solutions, and solar power. It is also involved in the marketing, trading, processing, and transportation of crude oil and condensate, natural gas, NGL and refined products, including refineries, terminals, and processing plant operation; power and emissions trading; development of transportation solutions for natural gas, liquids, and crude oil, including pipelines, shipping, trucking, and rail; and provision of low carbon solutions. The company was formerly known as Statoil ASA and changed its name to Equinor ASA in May 2018. Equinor ASA was incorporated in 1972 and is headquartered in Stavanger, Norway.
日內區間
目前US$43.94
52週區間
目前US$43.94
獲利能力占已公布營收的百分比。
營收
營業利益
淨利
| 項目(USD) | 2025會計年度 | 2024會計年度 | 2023會計年度 | 2022會計年度 | 2021會計年度 |
|---|---|---|---|---|---|
| 營收 | 1061.56億 USD | 1025.02億 USD | 1068.48億 USD | 1490.04億 USD | 887.44億 USD |
| 銷貨成本 | 776.61億 USD | 598.75億 USD | 588.09億 USD | 601.97億 USD | 468.79億 USD |
| 毛利 | 284.95億 USD | 426.27億 USD | 480.39億 USD | 888.07億 USD | 418.65億 USD |
| 銷售、一般及管理費用 | 12.11億 USD | 12.55億 USD | 12.18億 USD | 9.86億 USD | 7.8億 USD |
| 營業費用 | 12.11億 USD | 117億 USD | 122.69億 USD | 99.96億 USD | 82.02億 USD |
| 利息收入 | 11.79億 USD | 18.01億 USD | 22.31億 USD | 11.29億 USD | 1.12億 USD |
| 利息支出 | 14.4億 USD | 10.57億 USD | 11.22億 USD | 9.29億 USD | 7.69億 USD |
| 折舊和攤銷 | 98.67億 USD | 99.06億 USD | 111.83億 USD | 67.33億 USD | 108.5億 USD |
| 營業利益 | 272.84億 USD | 309.27億 USD | 357.7億 USD | 788.11億 USD | 336.63億 USD |
| 淨利 | 50.59億 USD | 88.06億 USD | 118.85億 USD | 287.46億 USD | 85.63億 USD |
公司資料更新於 2026年10月13日。
近期已公布業績
近期已公布業績
第三方分析師預期可能變動,並非 GoAI 建議。
平均目標
US$87.50
上漲空間 99.14%年度分割調整後的每股現金分配。
US$1.81
2025年(完整年度)+223.2% 自從 2021
2026年(部分年度):US$1.15
US$0.56
2,021
US$1.68
2,022
US$3.60
2,023
US$3.00
2,024
US$1.81
2,025
US$1.15
2,026*
* 在現有股息歷史記錄中,該日曆年僅包含部分期間。
| 行動 | 除息日 | 詳情 | 記錄日期 | 付款日期 |
|---|---|---|---|---|
股息即將實施 | 2026年11月16日 | US$0.39Quarterly | 2026年11月16日 | 2026年11月25日 |
股息 | 2026年8月14日 | US$0.39Quarterly | 2026年8月14日 | 2026年8月27日 |
股息 | 2026年5月15日 | US$0.39Quarterly | 2026年5月15日 | 2026年5月27日 |
股息 | 2026年2月17日 | US$0.37Quarterly | 2026年2月17日 | 2026年2月27日 |
股息 | 2025年11月14日 | US$0.37Quarterly | 2025年11月14日 | 2025年11月26日 |
股息 | 2025年8月19日 | US$0.37Quarterly | 2025年8月19日 | 2025年8月29日 |
除息 2026年11月16日
US$0.39
Quarterly
2026年11月16日登記 · 支付日 2026年11月25日
除息 2026年8月14日
US$0.39
Quarterly
2026年8月14日登記 · 支付日 2026年8月27日
除息 2026年5月15日
US$0.39
Quarterly
2026年5月15日登記 · 支付日 2026年5月27日
除息 2026年2月17日
US$0.37
Quarterly
2026年2月17日登記 · 支付日 2026年2月27日
除息 2025年11月14日
US$0.37
Quarterly
2025年11月14日登記 · 支付日 2025年11月26日
除息 2025年8月19日
US$0.37
Quarterly
2025年8月19日登記 · 支付日 2025年8月29日
報告持有此股票曝險的交易所交易基金。
 Schwab Fundamental International Large Company Index ETFFNDF1.45億0.57%253.2億 USD0.25%US$53.42-0.35%
 Schwab International Equity ETFSCHF6011.4萬0.09%674.08億 USD0.03%US$27.13-0.51%
 State Street SPDR Portfolio Developed World ex-US ETFSPDW5286.07萬0.13%404.62億 USD0.03%US$49.69-0.58%
 State Street SPDR S&P Global Natural Resources ETFGNR3507.29萬0.68%51.31億 USD0.40%US$75.84+0.36%
 iShares Flexible Equity Active ETFBFLX2711.13萬1.24%21.85億 USD0.40%US$26.0718-0.17%
 Avantis International Equity ETFAVDE2204.68萬0.11%192.24億 USD0.23%US$89.58-0.24%
 GMO International Value ETFGMOI1542.75萬2.40%6.54億 USD0.60%US$39.17-0.03%
 State Street SPDR MSCI EAFE StrategicFactors ETFQEFA634.13萬0.64%9.96億 USD0.30%US$97.45-0.24%Schwab Fundamental International Large Company Index ETFFNDFSchwab International Equity ETFSCHFState Street SPDR Portfolio Developed World ex-US ETFSPDWState Street SPDR S&P Global Natural Resources ETFGNRiShares Flexible Equity Active ETFBFLXAvantis International Equity ETFAVDEGMO International Value ETFGMOIState Street SPDR MSCI EAFE StrategicFactors ETFQEFA
AI 生成內容及延遲市場資料僅供資訊與教育用途,不構成投資建議。