
August Market Outlook: Equities Historically Face Headwinds as Dollar and Gold Ride Seasonal Tailwinds

As the calendar turns to August, financial analysts suggest investors might want to keep one hand on the steering wheel and the other firmly resting near the hedge button.
Paul Ciana, Technical Analyst at BofA Securities, highlighted in his latest seasonal report that historical patterns point toward a more conservative market footprint over the next three months.
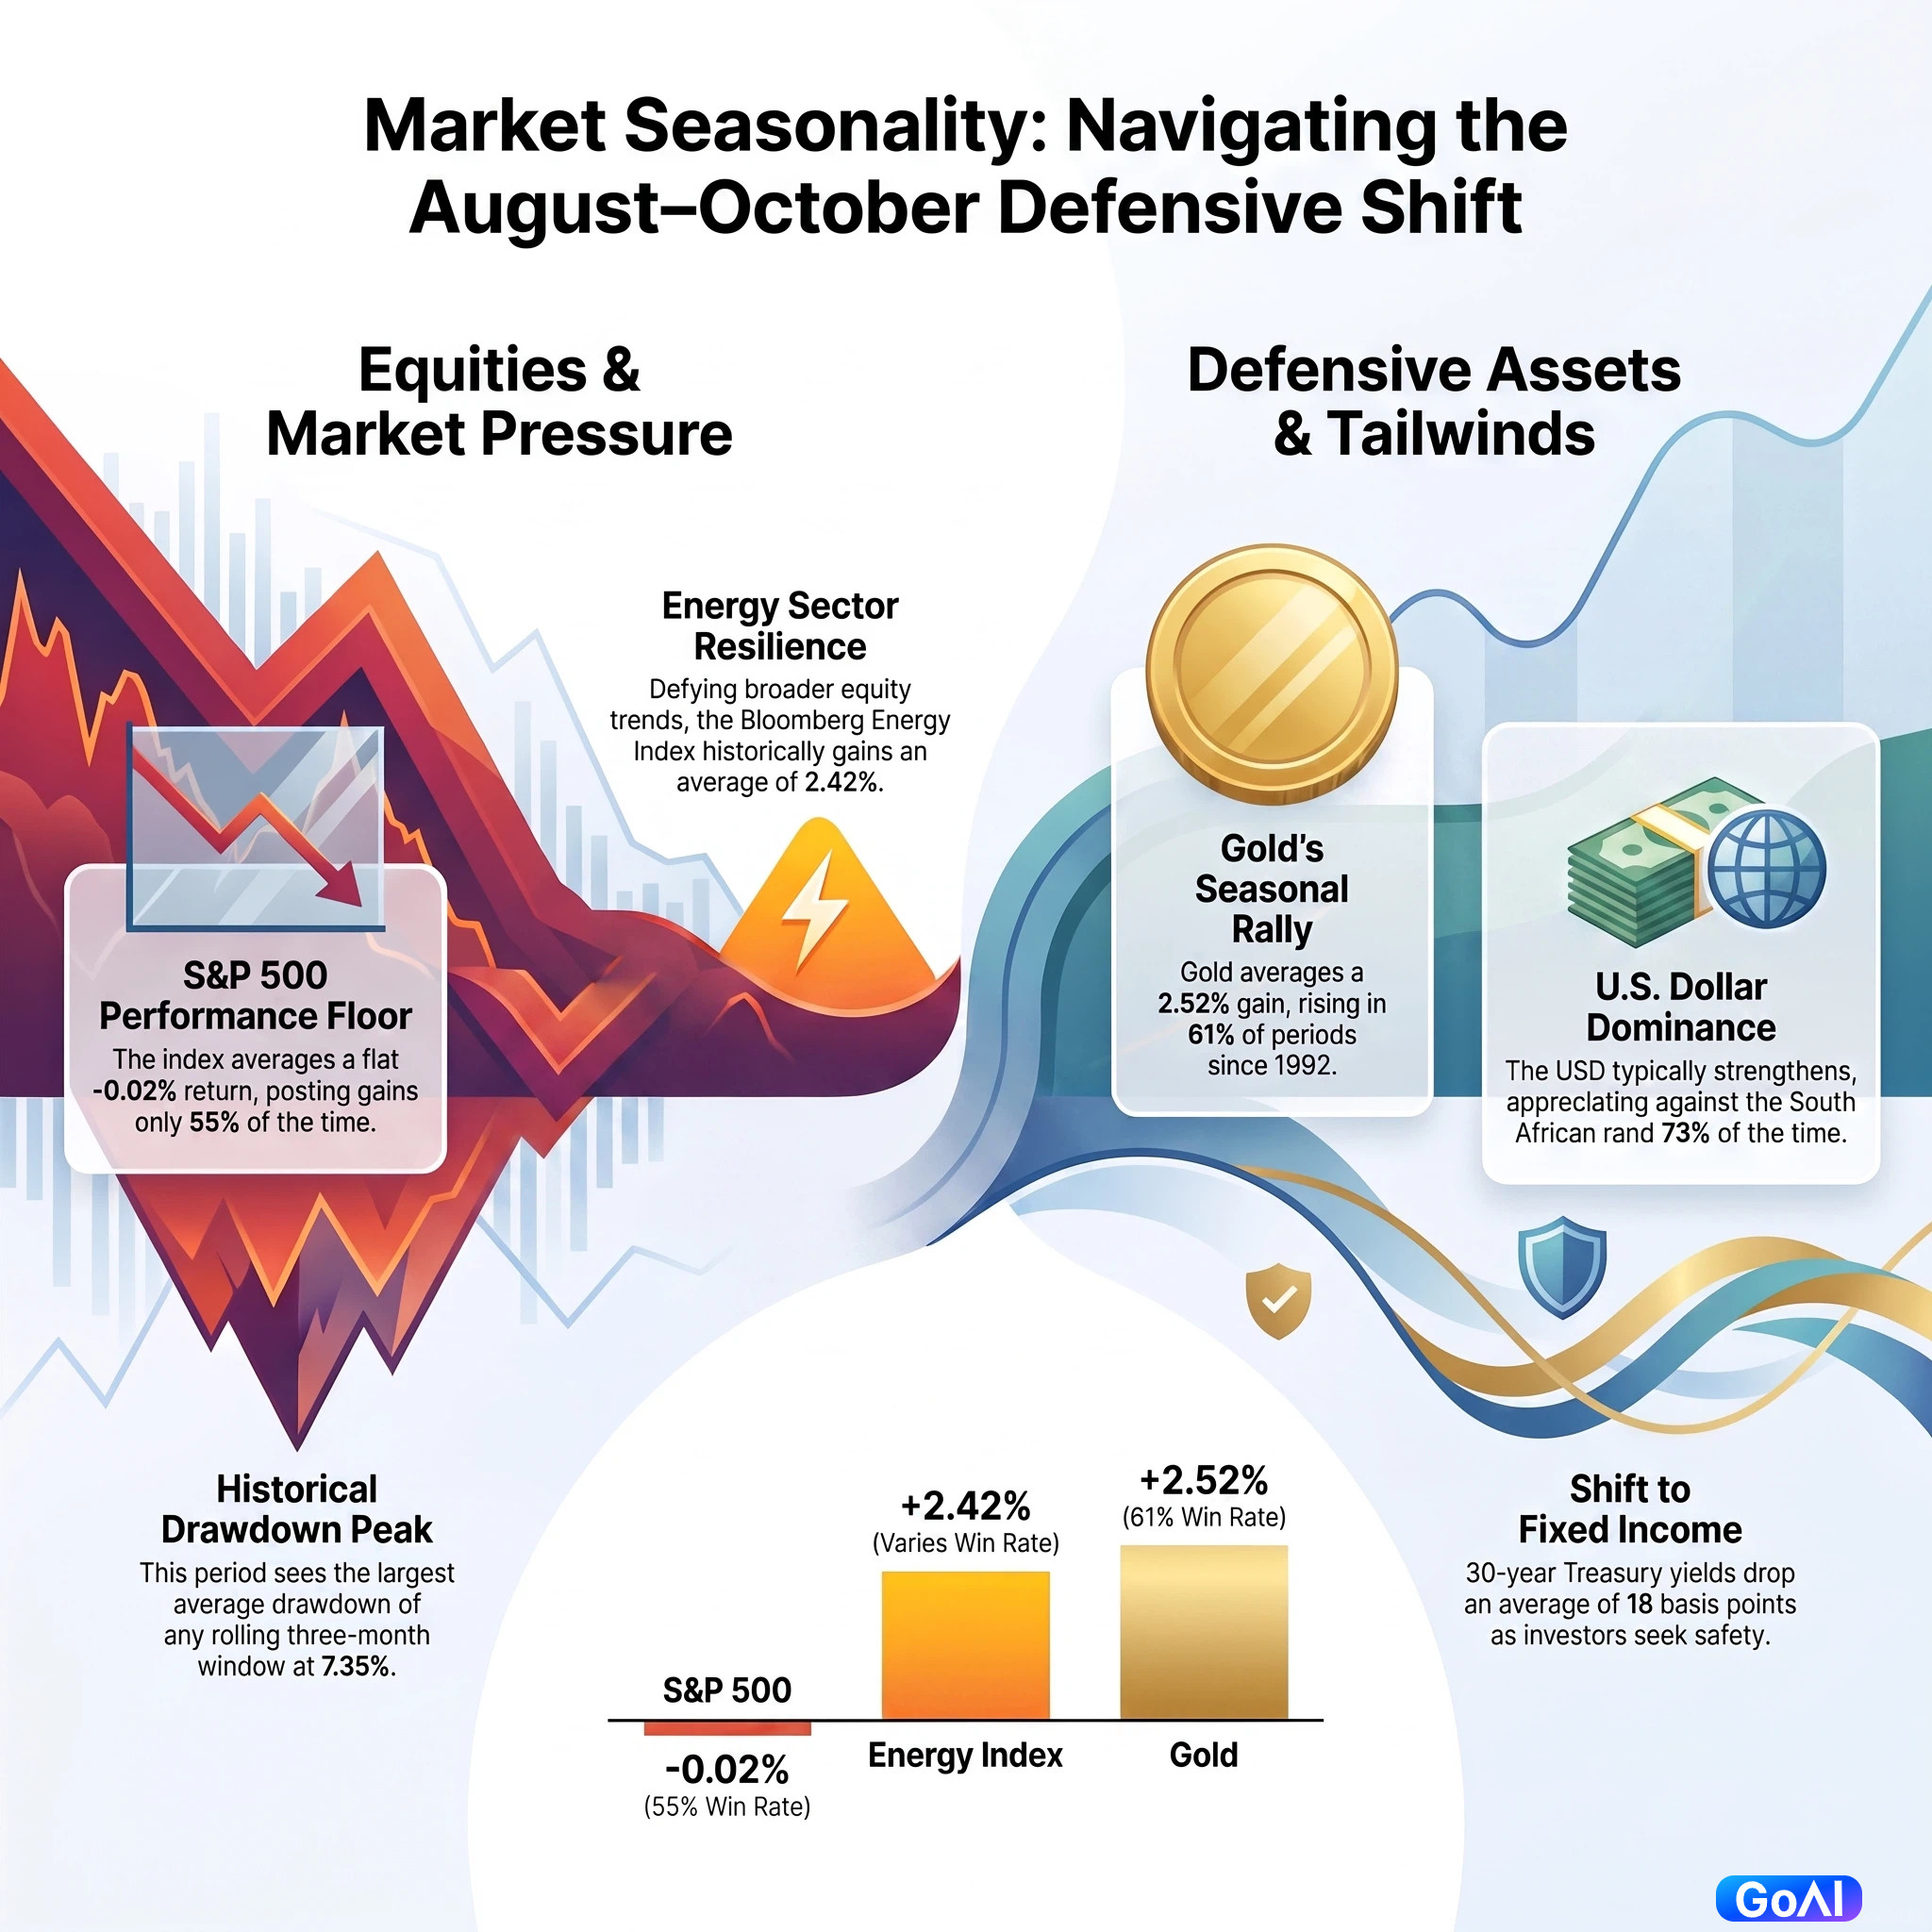
Drawing on decades of market data, Ciana noted that August through October historically represents the weakest three-month stretch for the S&P 500, whereas the U.S. dollar, gold, and fixed income tend to outperform.
While emphasizing that seasonality is only one factor among many for investors to weigh, Ciana noted that historical evidence favours defensive positioning—specifically increasing allocations to the U.S. dollar and gold while maintaining caution on equities until the market enters its historically robust November-to-January stretch.
Equities Under Pressure
History shows that August is rarely kind to stock markets.
According to Bank of America data dating back to 1928, the August-to-October stretch marks the worst average three-month performance for the S&P 500.
During this window, the index posts positive returns only 55% of the time, with a flat average return of -0.02%.
Furthermore, it suffers the largest average drawdown of any rolling three-month period, reaching 7.35%.
These historical dynamics reinforce the defensive stance Bank of America has maintained since late May.
However, Ciana cautioned that seasonal softness does not necessarily signal a structural bear market.
Historically, late-summer pullbacks often set the stage for one of the market's strongest periods, with the S&P 500 averaging a 3.54% gain between November and January.
The report also noted that seasonal headwinds are not distributed equally across all benchmark indices.
Historically, the Dow Jones Industrial Average stands out as the most resilient major U.S. index in August, posting positive returns 62% of the time with an average gain of 0.86%.
Additionally, international equities generally underperform U.S. markets during the month.
Against a broader risk-off backdrop, the energy sector presents a notable exception.
The Bloomberg Energy Index has historically gained an average of 2.42% in August, showing even stronger performance during the second year of a presidential term.
The report also pointed out that crude oil prices tend to firm up during the final third of August, offering potential support for energy-related trades.
U.S. Dollar Strength Likely to Persist
The report indicates that August typically presents a highly favorable backdrop for the U.S. dollar.
Among G10 currencies, the dollar historically exhibits particular strength against the British pound and the Australian dollar.
Since 2000, the dollar has advanced against sterling 65% of the time in August and against the Aussie dollar 69% of the time.
This seasonal trend is even more pronounced during the second year of the U.S. presidential election cycle.
In emerging markets, the South African rand exhibits the weakest seasonal pattern.
The dollar has appreciated against the rand 73% of the time in August, posting an average gain of 2.19%.
This makes USD/ZAR one of the bank’s preferred seasonal trades, particularly if market sentiment shifts toward a risk-off environment.
Treasury Yields Trend Lower
Bank of America's findings also show that August historically favors lower government bond yields.
The U.S. 30-year Treasury yield tends to trend downward during August, particularly in Year 2 of the presidential cycle, declining in roughly three-quarters of observed periods with an average drop of 18 basis points.
The downward bias is even sharper for Australian 10-year government bond yields, which have fallen 73% of the time in August.
Falling yields typically reflect a shift toward conservative portfolio positioning as investors seek the relative safety of government bonds.
Gold Stands Out
Among major macro asset classes, gold emerges as one of the clearest beneficiaries of the late-summer seasonal shift.
Since 1992, gold has posted positive returns 61% of the time between August and October, with an average gain of 2.52%.
Historically, gold prices tend to rally when equities soften and Treasury yields fall, making bullion one of the top recommended seasonal hedges against stock market volatility in the report.