読み込み中
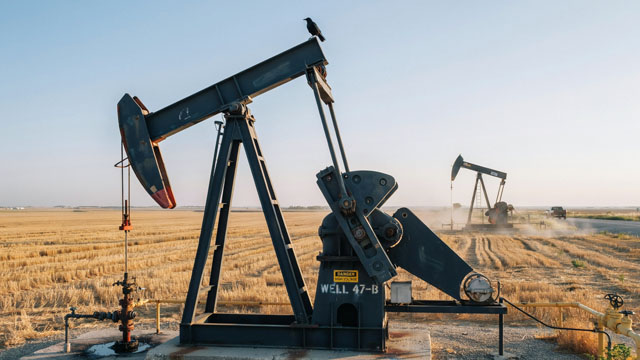
Cenovus Energy Inc. is an integrated energy firm involved in the exploration, extraction, processing, and sale of crude oil, natural gas liquids, and natural gas. Its operations span Canada, the United States, and the Asia Pacific region. The company organizes its extensive activities across six core segments: Oil Sands, Conventional, Offshore, Canadian Manufacturing, U.S. Manufacturing, and Retail. The Oil Sands division is responsible for developing and producing bitumen and heavy oil from significant projects in northern Alberta and Saskatchewan, including Foster Creek, Christina Lake, Sunrise, and Tucker, in addition to its Lloydminster thermal and conventional heavy oil operations. Cenovus’s Conventional segment encompasses assets primarily situated in Alberta and British Columbia, specifically in areas such as Elmworth-Wapiti, Kaybob-Edson, Clearwater, and Rainbow Lake, alongside holdings in various natural gas processing facilities. The Offshore segment is solely dedicated to exploration and development endeavors. Its Canadian Manufacturing segment includes the proprietary Lloydminster upgrading and asphalt refining complex, which converts heavy oil and bitumen into synthetic crude oil, diesel fuel, asphalt, and other related products. This segment also oversees the Bruderheim crude-by-rail terminal and operates two ethanol plants. The U.S. Manufacturing segment focuses on refining crude oil to produce diesel, gasoline, jet fuel, asphalt, and various other petroleum products. Finally, the Retail segment manages the distribution and sales of both its own and third-party refined petroleum products through a network of retail, commercial, and bulk petroleum outlets, as well as wholesale channels. Cenovus Energy Inc. was founded in 2009 and maintains its corporate headquarters in Calgary, Canada.
前日終値
$31.39
−$0.095 · -0.30%
日中の時刻はETです。市場データは遅延する場合があります。
Cenovus Energy Inc. is an integrated energy firm involved in the exploration, extraction, processing, and sale of crude oil, natural gas liquids, and natural gas. Its operations span Canada, the United States, and the Asia Pacific region. The company organizes its extensive activities across six core segments: Oil Sands, Conventional, Offshore, Canadian Manufacturing, U.S. Manufacturing, and Retail. The Oil Sands division is responsible for developing and producing bitumen and heavy oil from significant projects in northern Alberta and Saskatchewan, including Foster Creek, Christina Lake, Sunrise, and Tucker, in addition to its Lloydminster thermal and conventional heavy oil operations. Cenovus’s Conventional segment encompasses assets primarily situated in Alberta and British Columbia, specifically in areas such as Elmworth-Wapiti, Kaybob-Edson, Clearwater, and Rainbow Lake, alongside holdings in various natural gas processing facilities. The Offshore segment is solely dedicated to exploration and development endeavors. Its Canadian Manufacturing segment includes the proprietary Lloydminster upgrading and asphalt refining complex, which converts heavy oil and bitumen into synthetic crude oil, diesel fuel, asphalt, and other related products. This segment also oversees the Bruderheim crude-by-rail terminal and operates two ethanol plants. The U.S. Manufacturing segment focuses on refining crude oil to produce diesel, gasoline, jet fuel, asphalt, and various other petroleum products. Finally, the Retail segment manages the distribution and sales of both its own and third-party refined petroleum products through a network of retail, commercial, and bulk petroleum outlets, as well as wholesale channels. Cenovus Energy Inc. was founded in 2009 and maintains its corporate headquarters in Calgary, Canada.
日中レンジ
現在 $31.39
52週レンジ
現在 $31.39
日中の時刻はETです。市場データは遅延する場合があります。
GoAI スコア
買い
バリュエーション
94
大幅な割安
センチメント
62
強気
リスク
33
中程度のリスク
モメンタム
56
中立
GoAIの詳細リサーチ
詳しい根拠、カタリスト、リスクを確認できます。
Cenovus Energy Inc. is an integrated energy firm involved in the exploration, extraction, processing, and sale of crude oil, natural gas liquids, and natural gas. Its operations span Canada, the United States, and the Asia Pacific region. The company organizes its extensive activities across six core segments: Oil Sands, Conventional, Offshore, Canadian Manufacturing, U.S. Manufacturing, and Retail. The Oil Sands division is responsible for developing and producing bitumen and heavy oil from significant projects in northern Alberta and Saskatchewan, including Foster Creek, Christina Lake, Sunrise, and Tucker, in addition to its Lloydminster thermal and conventional heavy oil operations. Cenovus’s Conventional segment encompasses assets primarily situated in Alberta and British Columbia, specifically in areas such as Elmworth-Wapiti, Kaybob-Edson, Clearwater, and Rainbow Lake, alongside holdings in various natural gas processing facilities. The Offshore segment is solely dedicated to exploration and development endeavors. Its Canadian Manufacturing segment includes the proprietary Lloydminster upgrading and asphalt refining complex, which converts heavy oil and bitumen into synthetic crude oil, diesel fuel, asphalt, and other related products. This segment also oversees the Bruderheim crude-by-rail terminal and operates two ethanol plants. The U.S. Manufacturing segment focuses on refining crude oil to produce diesel, gasoline, jet fuel, asphalt, and various other petroleum products. Finally, the Retail segment manages the distribution and sales of both its own and third-party refined petroleum products through a network of retail, commercial, and bulk petroleum outlets, as well as wholesale channels. Cenovus Energy Inc. was founded in 2009 and maintains its corporate headquarters in Calgary, Canada.
日中レンジ
現在 $31.39
52週レンジ
現在 $31.39
利用可能な期間全体で報告されたマージン。
売上高
営業利益
純利益
| 指標(CAD) | 2025年度 | 2024年度 | 2023年度 | 2022年度 | 2021年度 |
|---|---|---|---|---|---|
| 売上高 | 496.56億 CAD | 577.26億 CAD | 554.74億 CAD | 717.65億 CAD | 488.11億 CAD |
| 売上原価 | 444.64億 CAD | 449.61億 CAD | 427.7億 CAD | 546.31億 CAD | 397.04億 CAD |
| 粗利益 | 51.92億 CAD | 127.65億 CAD | 127.04億 CAD | 171.34億 CAD | 91.07億 CAD |
| 販売・一般管理 | 8.11億 CAD | 7.94億 CAD | 6.88億 CAD | 8.65億 CAD | 8.49億 CAD |
| 営業費用 | 8.11億 CAD | 77.04億 CAD | 70.82億 CAD | 67.82億 CAD | 55.83億 CAD |
| 受取利息 | 1.41億 CAD | 1.7億 CAD | 2.17億 CAD | 1.1億 CAD | 2300万 CAD |
| 支払利息 | 4.67億 CAD | 6.49億 CAD | 7.23億 CAD | 8.12億 CAD | 10.48億 CAD |
| 減価償却費と償却費 | 54.31億 CAD | 48.71億 CAD | 46.24億 CAD | 43.1億 CAD | 43.22億 CAD |
| 営業利益 | 43.8億 CAD | 50.61億 CAD | 56.22億 CAD | 103.52億 CAD | 35.24億 CAD |
| 純利益 | 39.27億 CAD | 31.42億 CAD | 41.09億 CAD | 64.5億 CAD | 5.87億 CAD |
会社概要が更新されました 2026年10月11日.
発表済み実績と利用可能なコンセンサス予想。
発表済み実績と利用可能なコンセンサス予想。
第三者のアナリスト予想は変更される場合があり、GoAIの推奨ではありません。
平均目標
$36.00
上昇余地(14.69%)この株式へのエクスポージャーを報告している上場投資信託です。
 Dimensional - International Value ETFDFIV1.34億0.63%213.87億 USD0.27%$55.42+0.25%
 Dimensional - International Core Equity 2 ETFDFIC4041.34万0.27%150.17億 USD0.22%$37.53+0.64%
 Dimensional International High Profitability ETFDIHP3148.64万0.49%64.41億 USD0.27%$33.96+0.80%
 Invesco S&P International Developed Momentum ETFIDMO2331.93万0.55%42.62億 USD0.25%$60.19+0.40%
 John Hancock Exchange Traded Fund Trust - John Hancock Discipline Value Select ETFJDVL2177.77万2.31%9.43億 USD0.56%$31.98+1.01%
 Dimensional - International Core Equity Market ETFDFAI2014.09万0.11%177.82億 USD0.18%$41.34+0.66%
 Dimensional World ex U.S. Core Equity 2 ETFDFAX1773.72万0.15%123.36億 USD0.28%$37.08+0.76%
 iShares Dynamic Equity Active ETFBDYN1402.88万0.45%31.59億 USD0.40%$28.1232+0.69%Dimensional - International Value ETFDFIVDimensional - International Core Equity 2 ETFDFICDimensional International High Profitability ETFDIHPInvesco S&P International Developed Momentum ETFIDMOJohn Hancock Exchange Traded Fund Trust - John Hancock Discipline Value Select ETFJDVLDimensional - International Core Equity Market ETFDFAIDimensional World ex U.S. Core Equity 2 ETFDFAXiShares Dynamic Equity Active ETFBDYN
AIが生成した遅延市場データを、情報提供および教育目的で掲載しています。投資助言ではありません。