読み込み中
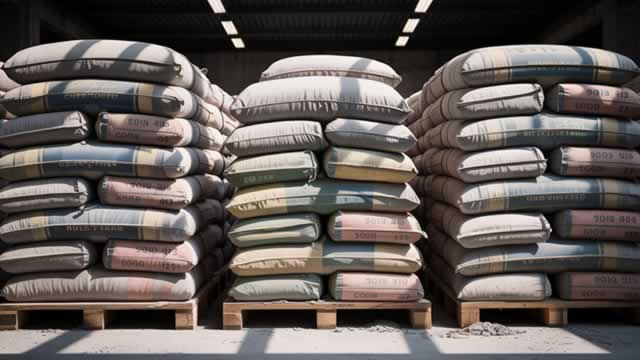
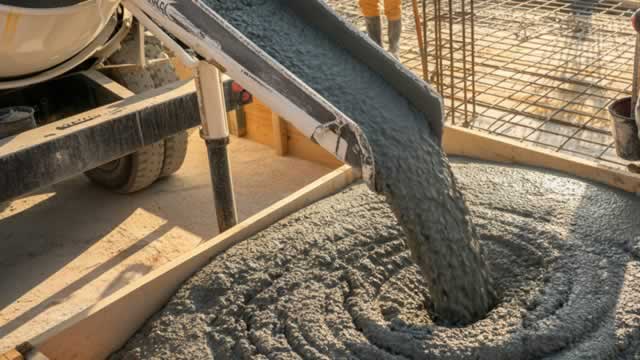
Eagle Materials Inc., operating through its subsidiaries across the United States, stands as a key producer and supplier of both heavy construction and light building materials. The company's diverse operations are organized into distinct segments: Cement; Concrete and Aggregates; Gypsum Wallboard; and Recycled Paperboard. Its core activities involve the mining of limestone for the comprehensive manufacture, distribution, and sale of Portland cement, alongside the grinding and distribution of slag. Additionally, Eagle Materials extracts gypsum to produce and market gypsum wallboard, an essential product utilized for finishing interior walls and ceilings in residential, commercial, and industrial structures. The firm also engages in the production and sale of recycled paperboard, catering to the gypsum wallboard industry and other paperboard converters, while also providing containerboard and lightweight packaging grades. Furthermore, its product portfolio includes ready-mix concrete, complemented by the mining, extraction, and sale of various aggregates such as crushed stone, sand, and gravel. These fundamental materials are integral to a broad spectrum of projects, ranging from residential and commercial building construction to public infrastructure developments and the critical construction, expansion, and repair of roads and highways. Established in 1963, the company was initially known as Centex Construction Products, Inc. before rebranding to Eagle Materials Inc. in January 2004. Its corporate headquarters are located in Dallas, Texas.
前日終値
$164.7
−$2.60 · -1.55%
日中の時刻はETです。市場データは遅延する場合があります。
Eagle Materials Inc., operating through its subsidiaries across the United States, stands as a key producer and supplier of both heavy construction and light building materials. The company's diverse operations are organized into distinct segments: Cement; Concrete and Aggregates; Gypsum Wallboard; and Recycled Paperboard. Its core activities involve the mining of limestone for the comprehensive manufacture, distribution, and sale of Portland cement, alongside the grinding and distribution of slag. Additionally, Eagle Materials extracts gypsum to produce and market gypsum wallboard, an essential product utilized for finishing interior walls and ceilings in residential, commercial, and industrial structures. The firm also engages in the production and sale of recycled paperboard, catering to the gypsum wallboard industry and other paperboard converters, while also providing containerboard and lightweight packaging grades. Furthermore, its product portfolio includes ready-mix concrete, complemented by the mining, extraction, and sale of various aggregates such as crushed stone, sand, and gravel. These fundamental materials are integral to a broad spectrum of projects, ranging from residential and commercial building construction to public infrastructure developments and the critical construction, expansion, and repair of roads and highways. Established in 1963, the company was initially known as Centex Construction Products, Inc. before rebranding to Eagle Materials Inc. in January 2004. Its corporate headquarters are located in Dallas, Texas.
日中レンジ
現在 $164.7
52週レンジ
現在 $164.7
日中の時刻はETです。市場データは遅延する場合があります。
GoAI スコア
中立
バリュエーション
76
割安
センチメント
71
強気
リスク
39
中程度のリスク
モメンタム
35
弱含み
GoAIの詳細リサーチ
詳しい根拠、カタリスト、リスクを確認できます。
Eagle Materials Inc., operating through its subsidiaries across the United States, stands as a key producer and supplier of both heavy construction and light building materials. The company's diverse operations are organized into distinct segments: Cement; Concrete and Aggregates; Gypsum Wallboard; and Recycled Paperboard. Its core activities involve the mining of limestone for the comprehensive manufacture, distribution, and sale of Portland cement, alongside the grinding and distribution of slag. Additionally, Eagle Materials extracts gypsum to produce and market gypsum wallboard, an essential product utilized for finishing interior walls and ceilings in residential, commercial, and industrial structures. The firm also engages in the production and sale of recycled paperboard, catering to the gypsum wallboard industry and other paperboard converters, while also providing containerboard and lightweight packaging grades. Furthermore, its product portfolio includes ready-mix concrete, complemented by the mining, extraction, and sale of various aggregates such as crushed stone, sand, and gravel. These fundamental materials are integral to a broad spectrum of projects, ranging from residential and commercial building construction to public infrastructure developments and the critical construction, expansion, and repair of roads and highways. Established in 1963, the company was initially known as Centex Construction Products, Inc. before rebranding to Eagle Materials Inc. in January 2004. Its corporate headquarters are located in Dallas, Texas.
日中レンジ
現在 $164.7
52週レンジ
現在 $164.7
利用可能な期間全体で報告されたマージン。
売上高
営業利益
純利益
| 指標(USD) | 2025年度 | 2024年度 | 2023年度 | 2022年度 | 2021年度 |
|---|---|---|---|---|---|
| 売上高 | 23.09億 USD | 22.61億 USD | 22.59億 USD | 21.48億 USD | 18.62億 USD |
| 売上原価 | 16.56億 USD | 15.87億 USD | 15.74億 USD | 15.09億 USD | 13.42億 USD |
| 粗利益 | 6.53億 USD | 6.73億 USD | 6.85億 USD | 6.39億 USD | 5.2億 USD |
| 販売・一般管理 | 8918.2万 USD | 7394.2万 USD | 5979.5万 USD | 5363万 USD | 4680.1万 USD |
| 営業費用 | 9165.4万 USD | 7394.2万 USD | 5979.5万 USD | 5363万 USD | 4680.1万 USD |
| 受取利息 | 615.6万 USD | 171.8万 USD | 104.3万 USD | 42.1万 USD | 3.9万 USD |
| 支払利息 | 5898.5万 USD | 4224.4万 USD | 4330万 USD | 3559.2万 USD | 3091.2万 USD |
| 減価償却費と償却費 | 1.65億 USD | 1.59億 USD | 1.5億 USD | 1.39億 USD | 1.29億 USD |
| 営業利益 | 5.61億 USD | 5.99億 USD | 6.26億 USD | 5.86億 USD | 4.73億 USD |
| 純利益 | 4.24億 USD | 4.63億 USD | 4.78億 USD | 4.62億 USD | 3.74億 USD |
会社概要が更新されました 2026年10月11日.
直近の発表実績
直近の発表実績
第三者のアナリスト予想は変更される場合があり、GoAIの推奨ではありません。
平均目標
$195.5
上昇余地(18.70%)分割調整後の1株当たりの年間現金分配金。
$1.00
2025年(通年)+150.0% 以来 2019
2026年(一部):$0.75
$0.40
2,019
$1.00
2,022
$1.00
2,023
$1.00
2,024
$1.00
2,025
$0.75
2,026*
* 利用可能な配当履歴のうち、暦年の一部のみを含みます。
| 種別 | 配当落ち日 | 詳細 | 基準日 | 支払日 |
|---|---|---|---|---|
配当 | 2026年9月14日 | $0.25Quarterly | 2026年9月14日 | 2026年10月13日 |
配当 | 2026年6月15日 | $0.25Quarterly | 2026年6月15日 | 2026年7月20日 |
配当 | 2026年3月16日 | $0.25Quarterly | 2026年3月16日 | 2026年4月13日 |
配当 | 2025年12月15日 | $0.25Quarterly | 2025年12月15日 | 2026年1月12日 |
配当 | 2025年9月15日 | $0.25Quarterly | 2025年9月15日 | 2025年10月16日 |
配当 | 2025年6月16日 | $0.25Quarterly | 2025年6月16日 | 2025年7月14日 |
配当落ち 2026年9月14日
$0.25
Quarterly
2026年9月14日基準 · 支払日 2026年10月13日
配当落ち 2026年6月15日
$0.25
Quarterly
2026年6月15日基準 · 支払日 2026年7月20日
配当落ち 2026年3月16日
$0.25
Quarterly
2026年3月16日基準 · 支払日 2026年4月13日
配当落ち 2025年12月15日
$0.25
Quarterly
2025年12月15日基準 · 支払日 2026年1月12日
配当落ち 2025年9月15日
$0.25
Quarterly
2025年9月15日基準 · 支払日 2025年10月16日
配当落ち 2025年6月16日
$0.25
Quarterly
2025年6月16日基準 · 支払日 2025年7月14日
この株式へのエクスポージャーを報告している上場投資信託です。
 Vanguard Morningstar Total Stock Market ETFVTI1.91億0.01%2.3兆 USD0.03%$381.94+0.63%
 Vanguard Morningstar Small-Cap ETFVB1.38億0.07%1853億 USD0.03%$289.48+0.64%
 Avantis U.S. Small Cap Value ETFAVUV1.18億0.38%308.51億 USD0.25%$119.64-0.41%
 Vanguard Morningstar Small-Cap Growth ETFVBK7939.85万0.17%447億 USD0.05%$344.74+1.22%
 Vanguard Extended Market ETFVXF7095.42万0.07%954億 USD0.05%$235+0.80%
 Global X - U.S. Infrastructure Development ETFPAVE4199.85万0.31%136.69億 USD0.47%$53.45+0.38%
 State Street SPDR S&P MIDCAP 400 ETF TrustMDY3812.76万0.15%258.17億 USD0.23%$669.87+0.54%
 Dimensional - US Small Cap ETFDFAS3712.47万0.11%338.69億 USD0.31%$78.35+0.32%Vanguard Morningstar Total Stock Market ETFVTIVanguard Morningstar Small-Cap ETFVBAvantis U.S. Small Cap Value ETFAVUVVanguard Morningstar Small-Cap Growth ETFVBKVanguard Extended Market ETFVXFGlobal X - U.S. Infrastructure Development ETFPAVEState Street SPDR S&P MIDCAP 400 ETF TrustMDYDimensional - US Small Cap ETFDFAS
AIが生成した遅延市場データを、情報提供および教育目的で掲載しています。投資助言ではありません。