読み込み中
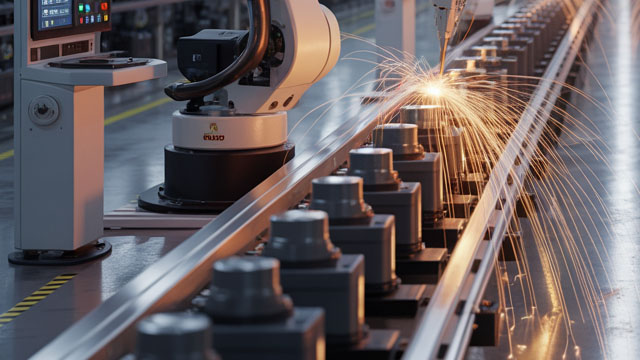
MKS Inc. (MKSI) functions as a worldwide supplier of sophisticated instruments, integrated systems, specialized components, and advanced process control solutions. The company's products are engineered to precisely measure, observe, deliver, evaluate, energize, and regulate essential operational factors within diverse manufacturing environments across the globe. Its offerings are categorized into three primary divisions: 1. Vacuum & Analysis: This segment provides cutting-edge solutions for managing pressure and vacuum, featuring both direct and indirect pressure sensing devices. It also offers material handling technologies, including flow and valve systems, alongside integrated pressure measurement and control subsystems designed for meticulous process regulation. Furthermore, it supplies power delivery apparatus such as microwave, radio frequency matching networks, and metrology tools, which are crucial for supplying energy to etching, stripping, and deposition procedures. Plasma and reactive gas products also fall under this division. 2. Light & Motion: Concentrating on light-based technologies, this unit features a broad spectrum of laser products, encompassing continuous wave, pulsed nanosecond, diode, diode-pumped solid-state, and fiber lasers. Its photonics portfolio includes motion control systems, optical tables with vibration isolation platforms, a variety of photonic instruments, precision optics and optical assemblies, opto-mechanical parts, temperature sensing devices vital for wafer fabrication, and laser/LED measurement equipment like power/energy meters, beam profilers, and optical/photonic subsystems. 3. Equipment & Solutions: This division specializes in laser-driven systems for printed circuit board (PCB) manufacturing. Its offerings cover flexible interconnect PCB processing and high-density interconnect solutions for rigid PCB production and substrate preparation. Additionally, it provides test systems for multi-layer ceramic capacitors. MKS Inc. serves a wide array of sectors, including semiconductor manufacturing, industrial technologies, life and health sciences, academic research, and defense. The company distributes its products and services through its internal sales team, independent distributors, sales representatives, and directly via its online platforms and product catalogs. Founded in 1961, MKS Inc. maintains its corporate headquarters in Andover, Massachusetts.
前日終値
$264.5
+$4.12 · +1.58%
日中の時刻はETです。市場データは遅延する場合があります。
GoAI スコア
中立
バリュエーション
38
割高
センチメント
56
まちまち
リスク
55
やや高いリスク
モメンタム
58
中立
GoAIの詳細リサーチ
詳しい根拠、カタリスト、リスクを確認できます。
MKS Inc. (MKSI) functions as a worldwide supplier of sophisticated instruments, integrated systems, specialized components, and advanced process control solutions. The company's products are engineered to precisely measure, observe, deliver, evaluate, energize, and regulate essential operational factors within diverse manufacturing environments across the globe. Its offerings are categorized into three primary divisions: 1. Vacuum & Analysis: This segment provides cutting-edge solutions for managing pressure and vacuum, featuring both direct and indirect pressure sensing devices. It also offers material handling technologies, including flow and valve systems, alongside integrated pressure measurement and control subsystems designed for meticulous process regulation. Furthermore, it supplies power delivery apparatus such as microwave, radio frequency matching networks, and metrology tools, which are crucial for supplying energy to etching, stripping, and deposition procedures. Plasma and reactive gas products also fall under this division. 2. Light & Motion: Concentrating on light-based technologies, this unit features a broad spectrum of laser products, encompassing continuous wave, pulsed nanosecond, diode, diode-pumped solid-state, and fiber lasers. Its photonics portfolio includes motion control systems, optical tables with vibration isolation platforms, a variety of photonic instruments, precision optics and optical assemblies, opto-mechanical parts, temperature sensing devices vital for wafer fabrication, and laser/LED measurement equipment like power/energy meters, beam profilers, and optical/photonic subsystems. 3. Equipment & Solutions: This division specializes in laser-driven systems for printed circuit board (PCB) manufacturing. Its offerings cover flexible interconnect PCB processing and high-density interconnect solutions for rigid PCB production and substrate preparation. Additionally, it provides test systems for multi-layer ceramic capacitors. MKS Inc. serves a wide array of sectors, including semiconductor manufacturing, industrial technologies, life and health sciences, academic research, and defense. The company distributes its products and services through its internal sales team, independent distributors, sales representatives, and directly via its online platforms and product catalogs. Founded in 1961, MKS Inc. maintains its corporate headquarters in Andover, Massachusetts.
日中レンジ
現在 $264.5
52週レンジ
現在 $264.5
利用可能な期間全体で報告されたマージン。
売上高
営業利益
純利益
| 指標(USD) | 2025年度 | 2024年度 | 2023年度 | 2022年度 | 2021年度 |
|---|---|---|---|---|---|
| 売上高 | 39.31億 USD | 35.86億 USD | 36.22億 USD | 35.47億 USD | 29.5億 USD |
| 売上原価 | 23.41億 USD | 18.78億 USD | 19.8億 USD | 20億 USD | 15.7億 USD |
| 粗利益 | 15.9億 USD | 17.08億 USD | 16.42億 USD | 15.47億 USD | 13.8億 USD |
| 研究開発 | 2.99億 USD | 2.71億 USD | 2.88億 USD | 2.41億 USD | 2億 USD |
| 販売・一般管理 | 7.24億 USD | 6.74億 USD | 6.75億 USD | 4.88億 USD | 3.85億 USD |
| 営業費用 | 10.23億 USD | 12.1億 USD | 31.96億 USD | 9.3億 USD | 6.81億 USD |
| 受取利息 | 1400万 USD | 2100万 USD | 8300万 USD | 400万 USD | — |
| 支払利息 | 2.12億 USD | 3.45億 USD | 4.22億 USD | 1.77億 USD | 2500万 USD |
| 減価償却費と償却費 | 3.44億 USD | 3.48億 USD | 3.97億 USD | 2.16億 USD | 1.04億 USD |
| 営業利益 | 5.65億 USD | 4.98億 USD | −15.54億 USD | 6.17億 USD | 6.99億 USD |
| 純利益 | 2.95億 USD | 1.9億 USD | −18.41億 USD | 3.33億 USD | 5.51億 USD |
会社概要が更新されました 2026年10月12日.
直近の発表実績
直近の発表実績
第三者のアナリスト予想は変更される場合があり、GoAIの推奨ではありません。
平均目標
$404
上昇余地(52.74%)分割調整後の1株当たりの年間現金分配金。
$0.88
2025年(通年)+2.3% 以来 2021
2026年(一部):$0.75
$0.86
2,021
$0.88
2,022
$0.88
2,023
$0.88
2,024
$0.88
2,025
$0.75
2,026*
* 利用可能な配当履歴のうち、暦年の一部のみを含みます。
| 種別 | 配当落ち日 | 詳細 | 基準日 | 支払日 |
|---|---|---|---|---|
配当 | 2026年8月25日 | $0.25Quarterly | 2026年8月25日 | 2026年9月3日 |
配当 | 2026年6月3日 | $0.25Quarterly | 2026年6月3日 | 2026年6月12日 |
配当 | 2026年2月23日 | $0.25Quarterly | 2026年2月23日 | 2026年3月6日 |
配当 | 2025年11月24日 | $0.22Quarterly | 2025年11月24日 | 2025年12月5日 |
配当 | 2025年8月25日 | $0.22Quarterly | 2025年8月25日 | 2025年9月5日 |
配当 | 2025年5月27日 | $0.22Quarterly | 2025年5月27日 | 2025年6月6日 |
配当落ち 2026年8月25日
$0.25
Quarterly
2026年8月25日基準 · 支払日 2026年9月3日
配当落ち 2026年6月3日
$0.25
Quarterly
2026年6月3日基準 · 支払日 2026年6月12日
配当落ち 2026年2月23日
$0.25
Quarterly
2026年2月23日基準 · 支払日 2026年3月6日
配当落ち 2025年11月24日
$0.22
Quarterly
2025年11月24日基準 · 支払日 2025年12月5日
配当落ち 2025年8月25日
$0.22
Quarterly
2025年8月25日基準 · 支払日 2025年9月5日
配当落ち 2025年5月27日
$0.22
Quarterly
2025年5月27日基準 · 支払日 2025年6月6日
この株式へのエクスポージャーを報告している上場投資信託です。
 Vanguard Morningstar Total Stock Market ETFVTI5.5億0.02%2.3兆 USD0.03%$381.94+0.63%
 Vanguard Morningstar Small-Cap ETFVB3.98億0.21%1853億 USD0.03%$289.48+0.64%
 Invesco S&P MidCap Momentum ETFXMMO2.08億2.92%71.38億 USD0.34%$148.79+0.96%
 Vanguard Extended Market ETFVXF2.01億0.21%954億 USD0.05%$235+0.80%
 Vanguard Information Technology ETFVGT1.77億0.10%1702億 USD0.09%$127.98+0.57%
 State Street SPDR S&P MIDCAP 400 ETF TrustMDY1.32億0.51%258.17億 USD0.23%$669.87+0.54%
 Vanguard Morningstar Small-Cap Value ETFVBR1.26億0.18%682億 USD0.05%$234.43+0.22%
 Vanguard Morningstar Small-Cap Growth ETFVBK1.14億0.25%447億 USD0.05%$344.74+1.22%Vanguard Morningstar Total Stock Market ETFVTIVanguard Morningstar Small-Cap ETFVBInvesco S&P MidCap Momentum ETFXMMOVanguard Extended Market ETFVXFVanguard Information Technology ETFVGTState Street SPDR S&P MIDCAP 400 ETF TrustMDYVanguard Morningstar Small-Cap Value ETFVBRVanguard Morningstar Small-Cap Growth ETFVBK
AIが生成した遅延市場データを、情報提供および教育目的で掲載しています。投資助言ではありません。