
読み込み中
NASDAQFinancial ServicesFinancial - Credit Services
最新データ
$25.54
+$0.54 · +2.16%
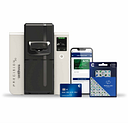
CPI Card Group Inc., along with its affiliated entities, specializes in the full spectrum of financial payment card services. This includes everything from the initial design and manufacturing to the personalized data integration, secure packaging, and final distribution of these cards. The company operates through two primary divisions: Debit and Credit, and Prepaid Debit. The Debit and Credit segment is responsible for producing various financial payment cards, such as those adhering to Europay, Mastercard, and Visa (EMV) standards, as well as non-EMV cards, premium metal cards, and custom private label credit cards. It also delivers extensive card-related services to financial institutions that issue cards. These services encompass on-demand solutions, individualizing cards with specific user data, managing fulfillment processes, and offering immediate card issuance capabilities. The Prepaid Debit segment focuses on providing integrated card services, notably secure, tamper-evident packaging, to suppliers of prepaid debit cards. Furthermore, this division manufactures financial payment cards that are issued under the major payment network brands. CPI Card Group serves a broad range of clients across the United States. Its customers include issuers of both debit and credit cards, administrators of Prepaid Debit Card programs, local community banks, credit unions, collective service providers, and companies involved in processing card transactions. Originally established in 2007, the company was known as CPI Holdings I, Inc. It subsequently adopted its current name, CPI Card Group Inc., in August 2015. The corporate headquarters are situated in Littleton, Colorado.
前日終値
$25.54
+$0.54 · +2.16%
日中の時刻はETです。市場データは遅延する場合があります。
CPI Card Group Inc., along with its affiliated entities, specializes in the full spectrum of financial payment card services. This includes everything from the initial design and manufacturing to the personalized data integration, secure packaging, and final distribution of these cards. The company operates through two primary divisions: Debit and Credit, and Prepaid Debit. The Debit and Credit segment is responsible for producing various financial payment cards, such as those adhering to Europay, Mastercard, and Visa (EMV) standards, as well as non-EMV cards, premium metal cards, and custom private label credit cards. It also delivers extensive card-related services to financial institutions that issue cards. These services encompass on-demand solutions, individualizing cards with specific user data, managing fulfillment processes, and offering immediate card issuance capabilities. The Prepaid Debit segment focuses on providing integrated card services, notably secure, tamper-evident packaging, to suppliers of prepaid debit cards. Furthermore, this division manufactures financial payment cards that are issued under the major payment network brands. CPI Card Group serves a broad range of clients across the United States. Its customers include issuers of both debit and credit cards, administrators of Prepaid Debit Card programs, local community banks, credit unions, collective service providers, and companies involved in processing card transactions. Originally established in 2007, the company was known as CPI Holdings I, Inc. It subsequently adopted its current name, CPI Card Group Inc., in August 2015. The corporate headquarters are situated in Littleton, Colorado.
日中レンジ
現在 $25.54
52週レンジ
現在 $25.54
日中の時刻はETです。市場データは遅延する場合があります。
GoAI スコア
中立
バリュエーション
49
適正価値
センチメント
70
強気
リスク
52
やや高いリスク
モメンタム
64
上昇基調
GoAIの詳細リサーチ
詳しい根拠、カタリスト、リスクを確認できます。
CPI Card Group Inc., along with its affiliated entities, specializes in the full spectrum of financial payment card services. This includes everything from the initial design and manufacturing to the personalized data integration, secure packaging, and final distribution of these cards. The company operates through two primary divisions: Debit and Credit, and Prepaid Debit. The Debit and Credit segment is responsible for producing various financial payment cards, such as those adhering to Europay, Mastercard, and Visa (EMV) standards, as well as non-EMV cards, premium metal cards, and custom private label credit cards. It also delivers extensive card-related services to financial institutions that issue cards. These services encompass on-demand solutions, individualizing cards with specific user data, managing fulfillment processes, and offering immediate card issuance capabilities. The Prepaid Debit segment focuses on providing integrated card services, notably secure, tamper-evident packaging, to suppliers of prepaid debit cards. Furthermore, this division manufactures financial payment cards that are issued under the major payment network brands. CPI Card Group serves a broad range of clients across the United States. Its customers include issuers of both debit and credit cards, administrators of Prepaid Debit Card programs, local community banks, credit unions, collective service providers, and companies involved in processing card transactions. Originally established in 2007, the company was known as CPI Holdings I, Inc. It subsequently adopted its current name, CPI Card Group Inc., in August 2015. The corporate headquarters are situated in Littleton, Colorado.
日中レンジ
現在 $25.54
52週レンジ
現在 $25.54
利用可能な期間全体で報告されたマージン。
売上高
営業利益
純利益
| 指標(USD) | 2025年度 | 2024年度 | 2023年度 | 2022年度 | 2021年度 |
|---|---|---|---|---|---|
| 売上高 | 5.44億 USD | 4.81億 USD | 4.45億 USD | 4.76億 USD | 3.75億 USD |
| 売上原価 | 3.73億 USD | 3.09億 USD | 2.89億 USD | 3億 USD | 2.34億 USD |
| 粗利益 | 1.7億 USD | 1.71億 USD | 1.55億 USD | 1.76億 USD | 1.41億 USD |
| 販売・一般管理 | 1.15億 USD | 1.03億 USD | 8825.5万 USD | 9078.2万 USD | 7570.1万 USD |
| 営業費用 | 1.15億 USD | 1.08億 USD | 9389.9万 USD | 9663.7万 USD | 8196.2万 USD |
| 支払利息 | 3246.6万 USD | 3408.7万 USD | 2691.3万 USD | 2961.6万 USD | 3060.8万 USD |
| 減価償却費と償却費 | 2246.1万 USD | 1642万 USD | 1593.1万 USD | 1488.6万 USD | 1509.8万 USD |
| 営業利益 | 5484.1万 USD | 6279.2万 USD | 6159万 USD | 7913万 USD | 5946.4万 USD |
| 純利益 | 1495万 USD | 1952.1万 USD | 2398.5万 USD | 3654万 USD | 1594.1万 USD |
会社概要が更新されました 2026年10月11日.
直近の発表実績
直近の発表実績
第三者のアナリスト予想は変更される場合があり、GoAIの推奨ではありません。
平均目標
$31.00
上昇余地(21.38%)| 種別 | 配当落ち日 | 詳細 | 基準日 | 支払日 |
|---|---|---|---|---|
配当 | 2017年6月14日 | $0.045Quarterly | 2017年6月16日 | 2017年7月7日 |
配当 | 2017年3月15日 | $0.045Quarterly | 2017年3月17日 | 2017年4月7日 |
配当 | 2016年12月14日 | $0.045Quarterly | 2016年12月16日 | 2017年1月12日 |
配当 | 2016年9月14日 | $0.045Quarterly | 2016年9月16日 | 2016年10月7日 |
配当 | 2016年6月14日 | $0.045Quarterly | 2016年6月16日 | 2016年7月7日 |
配当 | 2016年3月15日 | $0.045Quarterly | 2016年3月17日 | 2016年4月7日 |
配当落ち 2017年6月14日
$0.045
Quarterly
2017年6月16日基準 · 支払日 2017年7月7日
配当落ち 2017年3月15日
$0.045
Quarterly
2017年3月17日基準 · 支払日 2017年4月7日
配当落ち 2016年12月14日
$0.045
Quarterly
2016年12月16日基準 · 支払日 2017年1月12日
配当落ち 2016年9月14日
$0.045
Quarterly
2016年9月16日基準 · 支払日 2016年10月7日
配当落ち 2016年6月14日
$0.045
Quarterly
2016年6月16日基準 · 支払日 2016年7月7日
配当落ち 2016年3月15日
$0.045
Quarterly
2016年3月17日基準 · 支払日 2016年4月7日
この株式へのエクスポージャーを報告している上場投資信託です。
 iShares Russell 2000 ETFIWM558.96万0.01%782.66億 USD0.19%$278.94+0.49%
 Vanguard Morningstar Total Stock Market ETFVTI531.82万0.00%2.3兆 USD0.03%$381.94+0.63%
 Vanguard Information Technology ETFVGT436.67万0.00%1702億 USD0.09%$127.98+0.57%
 Inspire Fidelis Multi Factor ETFFDLS258.23万1.03%2.5億 USD0.66%$42.23+0.67%
 Vanguard Extended Market ETFVXF211.21万0.00%954億 USD0.05%$235+0.80%
 iShares Russell 2000 Growth ETFIWO184.79万0.01%139.72億 USD0.24%$356.78+0.94%
 Vanguard Russell 2000 ETFVTWO133.2万0.01%180億 USD0.06%$112.66+0.50%
 iShares Micro-Cap ETFIWC62.46万0.05%13.17億 USD0.60%$183+0.11%iShares Russell 2000 ETFIWMVanguard Morningstar Total Stock Market ETFVTIVanguard Information Technology ETFVGTInspire Fidelis Multi Factor ETFFDLSVanguard Extended Market ETFVXFiShares Russell 2000 Growth ETFIWOVanguard Russell 2000 ETFVTWOiShares Micro-Cap ETFIWC
AIが生成した遅延市場データを、情報提供および教育目的で掲載しています。投資助言ではありません。





