読み込み中
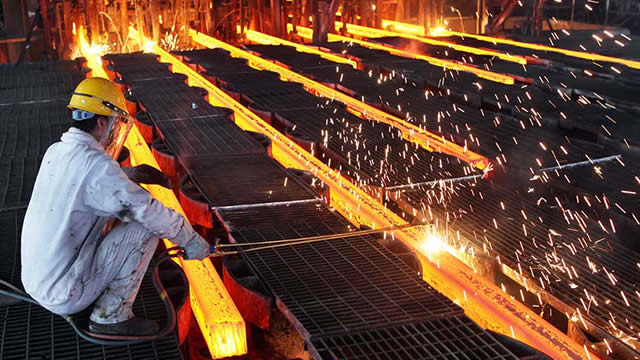
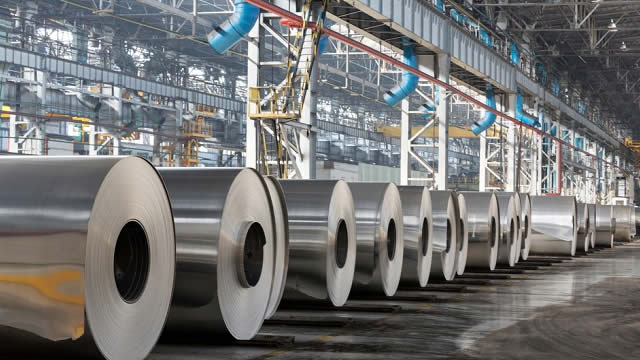
Companhia Siderúrgica Nacional (CSN) operates as an integrated steel manufacturer, holding a significant presence across Brazil and Latin America. Its operations are diversified across five key divisions: Steel, Mining, Logistics, Energy, and Cement. CSN’s comprehensive steel product range includes various flat steel offerings, such as specialized slabs (high, medium, low carbon, micro-alloyed, ultra-low-carbon, and interstitial free types). The company also provides hot-rolled and cold-rolled coils and sheets, galvanized products, and tin mill products, which are essentially flat-rolled low-carbon steel. Furthermore, CSN manufactures structural steel shapes like profiles, channels, UPE sections, and steel sleepers. These products serve a wide array of industries, including distribution, packaging, automotive, home appliances, and construction. In its mining segment, CSN extracts iron ore from the Casa de Pedra and Engenho mines near Congonhas, Brazil, and limestone and dolomite from the Bocaina mine in Arcos, both located in Minas Gerais state. The company additionally produces tin. Complementing these activities, CSN manages its own railway and port infrastructure, facilitating logistics. Its cement production is sold to a diverse customer base, including construction material stores, home centers, concrete producers, construction companies, mortar industries, and cement artifact manufacturers. Power generation is also a component of its business, with electricity produced from thermoelectric co-generation and hydroelectric plants. CSN also exports its products to international markets. Founded in 1941 and headquartered in São Paulo, Brazil, Companhia Siderúrgica Nacional functions as a subsidiary of Vicunha Aços S.A.
終値時点
$1.275
+$0.045 · +3.66%
日中の時刻はETです。市場データは遅延する場合があります。
Companhia Siderúrgica Nacional (CSN) operates as an integrated steel manufacturer, holding a significant presence across Brazil and Latin America. Its operations are diversified across five key divisions: Steel, Mining, Logistics, Energy, and Cement. CSN’s comprehensive steel product range includes various flat steel offerings, such as specialized slabs (high, medium, low carbon, micro-alloyed, ultra-low-carbon, and interstitial free types). The company also provides hot-rolled and cold-rolled coils and sheets, galvanized products, and tin mill products, which are essentially flat-rolled low-carbon steel. Furthermore, CSN manufactures structural steel shapes like profiles, channels, UPE sections, and steel sleepers. These products serve a wide array of industries, including distribution, packaging, automotive, home appliances, and construction. In its mining segment, CSN extracts iron ore from the Casa de Pedra and Engenho mines near Congonhas, Brazil, and limestone and dolomite from the Bocaina mine in Arcos, both located in Minas Gerais state. The company additionally produces tin. Complementing these activities, CSN manages its own railway and port infrastructure, facilitating logistics. Its cement production is sold to a diverse customer base, including construction material stores, home centers, concrete producers, construction companies, mortar industries, and cement artifact manufacturers. Power generation is also a component of its business, with electricity produced from thermoelectric co-generation and hydroelectric plants. CSN also exports its products to international markets. Founded in 1941 and headquartered in São Paulo, Brazil, Companhia Siderúrgica Nacional functions as a subsidiary of Vicunha Aços S.A.
日中レンジ
現在 $1.275
52週レンジ
現在 $1.275
日中の時刻はETです。市場データは遅延する場合があります。
GoAI スコア
売り
バリュエーション
65
割安
センチメント
40
弱気
リスク
72
高リスク
モメンタム
20
強い下落
GoAIの詳細リサーチ
詳しい根拠、カタリスト、リスクを確認できます。
Companhia Siderúrgica Nacional (CSN) operates as an integrated steel manufacturer, holding a significant presence across Brazil and Latin America. Its operations are diversified across five key divisions: Steel, Mining, Logistics, Energy, and Cement. CSN’s comprehensive steel product range includes various flat steel offerings, such as specialized slabs (high, medium, low carbon, micro-alloyed, ultra-low-carbon, and interstitial free types). The company also provides hot-rolled and cold-rolled coils and sheets, galvanized products, and tin mill products, which are essentially flat-rolled low-carbon steel. Furthermore, CSN manufactures structural steel shapes like profiles, channels, UPE sections, and steel sleepers. These products serve a wide array of industries, including distribution, packaging, automotive, home appliances, and construction. In its mining segment, CSN extracts iron ore from the Casa de Pedra and Engenho mines near Congonhas, Brazil, and limestone and dolomite from the Bocaina mine in Arcos, both located in Minas Gerais state. The company additionally produces tin. Complementing these activities, CSN manages its own railway and port infrastructure, facilitating logistics. Its cement production is sold to a diverse customer base, including construction material stores, home centers, concrete producers, construction companies, mortar industries, and cement artifact manufacturers. Power generation is also a component of its business, with electricity produced from thermoelectric co-generation and hydroelectric plants. CSN also exports its products to international markets. Founded in 1941 and headquartered in São Paulo, Brazil, Companhia Siderúrgica Nacional functions as a subsidiary of Vicunha Aços S.A.
日中レンジ
現在 $1.275
52週レンジ
現在 $1.275
利用可能な期間全体で報告されたマージン。
売上高
営業利益
純利益
| 指標(BRL) | 2025年度 | 2024年度 | 2023年度 | 2022年度 | 2021年度 |
|---|---|---|---|---|---|
| 売上高 | 439.18億 BRL | 436.87億 BRL | 454.38億 BRL | 443.62億 BRL | 479.12億 BRL |
| 売上原価 | 320.44億 BRL | 319.91億 BRL | 341.37億 BRL | 310.54億 BRL | 258.37億 BRL |
| 粗利益 | 118.74億 BRL | 116.97億 BRL | 113.01億 BRL | 133.08億 BRL | 220.75億 BRL |
| 研究開発 | 8293.8万 BRL | 5712.9万 BRL | 5830.3万 BRL | 5890.4万 BRL | 7741.4万 BRL |
| 販売・一般管理 | 60.68億 BRL | 63.54億 BRL | 44.9億 BRL | 33.1億 BRL | 30.08億 BRL |
| 営業費用 | 72.23億 BRL | 77.05億 BRL | 61.14億 BRL | 44.53億 BRL | 36.1億 BRL |
| 受取利息 | 10.14億 BRL | 10.3億 BRL | 1.13億 BRL | 7.78億 BRL | 2.79億 BRL |
| 支払利息 | 45.78億 BRL | 46.01億 BRL | 41.7億 BRL | 30.68億 BRL | 22.65億 BRL |
| 減価償却費と償却費 | 41.5億 BRL | 37.91億 BRL | 33.79億 BRL | 28.78億 BRL | 22.18億 BRL |
| 営業利益 | 46.52億 BRL | 39.92億 BRL | 51.87億 BRL | 88.55億 BRL | 184.65億 BRL |
| 純利益 | −19.63億 BRL | −25.92億 BRL | −3.18億 BRL | 15.54億 BRL | 122.59億 BRL |
会社概要が更新されました 2026年10月9日.
直近の発表実績
直近の発表実績
第三者のアナリスト予想は変更される場合があり、GoAIの推奨ではありません。
平均目標
$1.40
上昇余地(9.80%)分割調整後の1株当たりの年間現金分配金。
$0.2294
2024年(通年)-2.5% 以来 2019
$0.2353
2,019
$0.3734
2,021
$0.3999
2,022
$0.5041
2,023
$0.2294
2,024
| 種別 | 配当落ち日 | 詳細 | 基準日 | 支払日 |
|---|---|---|---|---|
配当 | 2024年11月29日 | $0.0919Semi-Annual | 2024年11月29日 | 2024年12月5日 |
配当 | 2024年5月22日 | $0.1375Semi-Annual | 2024年5月23日 | 2024年6月6日 |
配当 | 2023年11月22日 | $0.1517Annual | 2023年11月24日 | 2023年12月6日 |
配当 | 2023年5月10日 | $0.2458Special | 2023年5月11日 | 2023年5月24日 |
配当 | 2023年1月5日 | $0.1066Special | 2023年1月6日 | — |
配当 | 2022年12月1日 | $0.2254Semi-Annual | 2022年12月2日 | 2022年12月9日 |
配当落ち 2024年11月29日
$0.0919
Semi-Annual
2024年11月29日基準 · 支払日 2024年12月5日
配当落ち 2024年5月22日
$0.1375
Semi-Annual
2024年5月23日基準 · 支払日 2024年6月6日
配当落ち 2023年11月22日
$0.1517
Annual
2023年11月24日基準 · 支払日 2023年12月6日
配当落ち 2023年5月10日
$0.2458
Special
2023年5月11日基準 · 支払日 2023年5月24日
配当落ち 2023年1月5日
$0.1066
Special
2023年1月6日基準
配当落ち 2022年12月1日
$0.2254
Semi-Annual
2022年12月2日基準 · 支払日 2022年12月9日
この株式へのエクスポージャーを報告している上場投資信託です。
 Vanguard FTSE Emerging Markets ETFVWO230.03万0.00%1685億 USD0.06%$59.665+0.96%
 State Street SPDR Portfolio Emerging Markets ETFSPEM204.72万0.01%177.53億 USD0.07%$52.085+1.08%
 Vanguard Total International Stock ETFVXUS165.2万0.00%6657億 USD0.05%$84.6459+0.65%
 Vanguard FTSE All-World ex-US ETFVEU66.69万0.00%986億 USD0.04%$82.665+0.59%
 VanEck Steel ETFSLX60.22万0.38%1.57億 USD0.55%$102.8+0.82%
 VanEck Brazil Small-Cap ETFBRF51.59万1.95%2702.69万 USD0.60%$20.86+4.55%
 Vanguard Total World Stock ETFVT7.58万0.00%1017億 USD0.06%$159.74+0.63%
 State Street SPDR Portfolio MSCI Global Stock Market ETFSPGM6.81万0.00%18億 USD0.09%$87.295+0.39%Vanguard FTSE Emerging Markets ETFVWOState Street SPDR Portfolio Emerging Markets ETFSPEMVanguard Total International Stock ETFVXUSVanguard FTSE All-World ex-US ETFVEUVanEck Steel ETFSLXVanEck Brazil Small-Cap ETFBRFVanguard Total World Stock ETFVTState Street SPDR Portfolio MSCI Global Stock Market ETFSPGM
AIが生成した遅延市場データを、情報提供および教育目的で掲載しています。投資助言ではありません。