読み込み中
NYSEEnergyOil & Gas Exploration & Production
最新データ
$11.92
+$0.05 · +0.42%
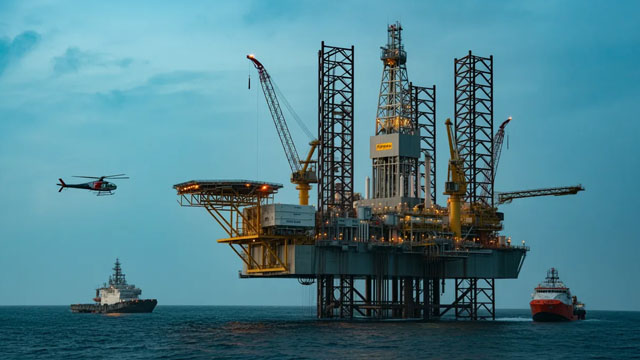
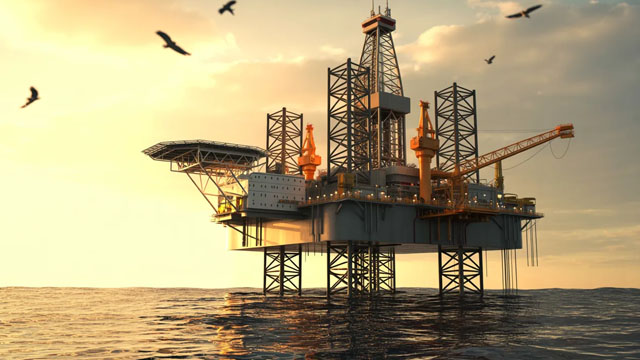
Vermilion Energy Inc., an international energy firm operating through its subsidiaries, focuses on the full lifecycle of oil and natural gas, encompassing their acquisition, exploration, development, and production. Its activities are geographically diverse, spanning North America, various European nations, and Australia. Established in 1994, the company's corporate headquarters are situated in Calgary, Canada. The company holds extensive property interests across its operational regions. In Canada, it possesses an 81% working interest in 636,714 net developed acres and an 85% working interest in 301,026 net undeveloped acres. Its U.S. presence includes 130,715 net acres within the Powder River basin. European landholdings are significant: in France, covering the Aquitaine and Paris Basins, it maintains a 96% working interest in 248,873 net developed acres and an 86% working interest in 134,160 net undeveloped acres. The Netherlands contributes a 53% working interest across 901,791 net acres. In Germany, Vermilion manages 54,625 net developed acres alongside 920,723 net undeveloped acres. Further European land positions include 975,375 net acres in Croatia, 946,666 net acres in Hungary, and 48,954 net acres in Slovakia. Beyond these land-based assets, Vermilion also participates in significant offshore production. It holds a 20% interest in the Corrib natural gas field, located off Ireland's northwest coast. In Australia, the company has a 100% working interest in the 59,553-acre Wandoo offshore oil field and its associated production facilities, situated on the northwest shelf. As of December 31, 2021, Vermilion's active well count included: Canada: 401 net conventional natural gas wells and 2,132 net light and medium crude oil wells. United States: 167.6 net light and medium crude oil wells. France: 297.0 net light and medium crude oil wells and 3 net conventional natural gas wells. Netherlands: 47 net natural gas wells.
終値時点
$11.92
+$0.05 · +0.42%
時間外
$11.92
$0.00 · 0.00%
10月12日 17:30 ET
日中の時刻はETです。市場データは遅延する場合があります。
Vermilion Energy Inc., an international energy firm operating through its subsidiaries, focuses on the full lifecycle of oil and natural gas, encompassing their acquisition, exploration, development, and production. Its activities are geographically diverse, spanning North America, various European nations, and Australia. Established in 1994, the company's corporate headquarters are situated in Calgary, Canada. The company holds extensive property interests across its operational regions. In Canada, it possesses an 81% working interest in 636,714 net developed acres and an 85% working interest in 301,026 net undeveloped acres. Its U.S. presence includes 130,715 net acres within the Powder River basin. European landholdings are significant: in France, covering the Aquitaine and Paris Basins, it maintains a 96% working interest in 248,873 net developed acres and an 86% working interest in 134,160 net undeveloped acres. The Netherlands contributes a 53% working interest across 901,791 net acres. In Germany, Vermilion manages 54,625 net developed acres alongside 920,723 net undeveloped acres. Further European land positions include 975,375 net acres in Croatia, 946,666 net acres in Hungary, and 48,954 net acres in Slovakia. Beyond these land-based assets, Vermilion also participates in significant offshore production. It holds a 20% interest in the Corrib natural gas field, located off Ireland's northwest coast. In Australia, the company has a 100% working interest in the 59,553-acre Wandoo offshore oil field and its associated production facilities, situated on the northwest shelf. As of December 31, 2021, Vermilion's active well count included: Canada: 401 net conventional natural gas wells and 2,132 net light and medium crude oil wells. United States: 167.6 net light and medium crude oil wells. France: 297.0 net light and medium crude oil wells and 3 net conventional natural gas wells. Netherlands: 47 net natural gas wells.
日中レンジ
現在 $11.92
52週レンジ
現在 $11.92
日中の時刻はETです。市場データは遅延する場合があります。
GoAI スコア
中立
バリュエーション
65
割安
センチメント
47
まちまち
リスク
47
やや高いリスク
モメンタム
27
弱含み
GoAIの詳細リサーチ
詳しい根拠、カタリスト、リスクを確認できます。
Vermilion Energy Inc., an international energy firm operating through its subsidiaries, focuses on the full lifecycle of oil and natural gas, encompassing their acquisition, exploration, development, and production. Its activities are geographically diverse, spanning North America, various European nations, and Australia. Established in 1994, the company's corporate headquarters are situated in Calgary, Canada. The company holds extensive property interests across its operational regions. In Canada, it possesses an 81% working interest in 636,714 net developed acres and an 85% working interest in 301,026 net undeveloped acres. Its U.S. presence includes 130,715 net acres within the Powder River basin. European landholdings are significant: in France, covering the Aquitaine and Paris Basins, it maintains a 96% working interest in 248,873 net developed acres and an 86% working interest in 134,160 net undeveloped acres. The Netherlands contributes a 53% working interest across 901,791 net acres. In Germany, Vermilion manages 54,625 net developed acres alongside 920,723 net undeveloped acres. Further European land positions include 975,375 net acres in Croatia, 946,666 net acres in Hungary, and 48,954 net acres in Slovakia. Beyond these land-based assets, Vermilion also participates in significant offshore production. It holds a 20% interest in the Corrib natural gas field, located off Ireland's northwest coast. In Australia, the company has a 100% working interest in the 59,553-acre Wandoo offshore oil field and its associated production facilities, situated on the northwest shelf. As of December 31, 2021, Vermilion's active well count included: Canada: 401 net conventional natural gas wells and 2,132 net light and medium crude oil wells. United States: 167.6 net light and medium crude oil wells. France: 297.0 net light and medium crude oil wells and 3 net conventional natural gas wells. Netherlands: 47 net natural gas wells.
日中レンジ
現在 $11.92
52週レンジ
現在 $11.92
利用可能な期間全体で報告されたマージン。
売上高
営業利益
純利益
| 指標(CAD) | 2025年度 | 2024年度 | 2023年度 | 2022年度 | 2021年度 |
|---|---|---|---|---|---|
| 売上高 | 17.64億 CAD | 20.74億 CAD | 22億 CAD | 37.21億 CAD | 22.27億 CAD |
| 売上原価 | 14.73億 CAD | 9.54億 CAD | 10.81億 CAD | 11.28億 CAD | 9.05億 CAD |
| 粗利益 | 2.91億 CAD | 11.2億 CAD | 11.18億 CAD | 25.93億 CAD | 13.22億 CAD |
| 販売・一般管理 | 1.24億 CAD | 1.29億 CAD | 1.23億 CAD | 1.02億 CAD | 1.72億 CAD |
| 営業費用 | 1.24億 CAD | 8.71億 CAD | 8.04億 CAD | 7.28億 CAD | 6.28億 CAD |
| 支払利息 | 1.33億 CAD | 8460.6万 CAD | 8521.2万 CAD | 8285.8万 CAD | 7307.5万 CAD |
| 減価償却費と償却費 | 7.68億 CAD | 6.83億 CAD | 7.13億 CAD | 5.77億 CAD | 5.72億 CAD |
| 営業利益 | 1.67億 CAD | 2.49億 CAD | 3.14億 CAD | 18.65億 CAD | 6.94億 CAD |
| 純利益 | −6.53億 CAD | −4673.9万 CAD | −2.38億 CAD | 13.13億 CAD | 11.49億 CAD |
会社概要が更新されました 2026年10月13日.
直近の発表実績
直近の発表実績
第三者のアナリスト予想は変更される場合があり、GoAIの推奨ではありません。
平均目標
$10.74
下落余地(9.90%)この株式へのエクスポージャーを報告している上場投資信託です。
 Dimensional - International Small Cap Value ETFDISV1043.06万0.21%50.56億 USD0.42%$42.50-0.34%
 First Trust Natural Gas ETFFCG1018.6万1.56%6.51億 USD0.59%$30.28+1.17%
 Dimensional - International Small Cap ETFDFIS415.15万0.07%57.5億 USD0.39%$35.93-0.28%
 Dimensional - International Core Equity 2 ETFDFIC344.72万0.02%150.17億 USD0.22%$37.47-0.16%
 Dimensional - International Core Equity Market ETFDFAI160.77万0.01%177.82億 USD0.18%$41.27-0.17%
 Dimensional World ex U.S. Core Equity 2 ETFDFAX141.65万0.01%123.36億 USD0.28%$36.92-0.43%
 Invesco RAFI Developed Markets ex-U.S. ETFPXF61.59万0.02%29.06億 USD0.43%$75.69-0.26%
 Dimensional - International Vector Equity ETFDXIV5.45万0.02%2.3億 USD0.53%$71.2881-0.64%Dimensional - International Small Cap Value ETFDISVFirst Trust Natural Gas ETFFCGDimensional - International Small Cap ETFDFISDimensional - International Core Equity 2 ETFDFICDimensional - International Core Equity Market ETFDFAIDimensional World ex U.S. Core Equity 2 ETFDFAXInvesco RAFI Developed Markets ex-U.S. ETFPXFDimensional - International Vector Equity ETFDXIV
AIが生成した遅延市場データを、情報提供および教育目的で掲載しています。投資助言ではありません。