載入中

NASDAQTechnologySemiconductors
最新資料
US$608.1
−US$12.58 · -2.03%
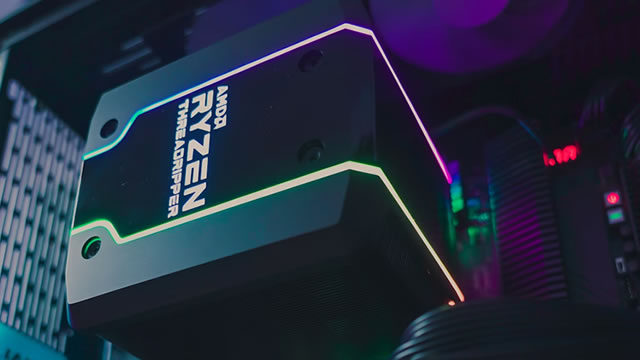
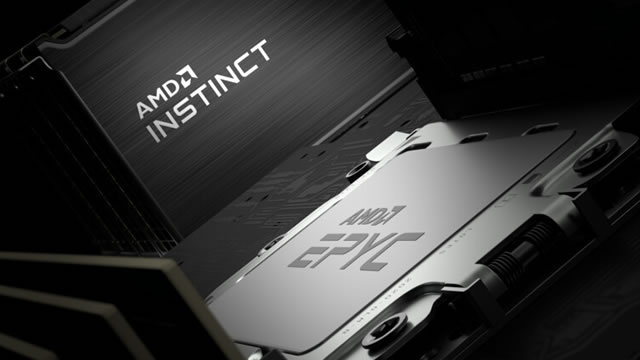
Advanced Micro Devices, Inc. (AMD), established in 1969 and headquartered in Santa Clara, California, operates as a global leader in the semiconductor industry. The company organizes its extensive operations into two primary segments: Computing and Graphics, and Enterprise, Embedded and Semi-Custom. In its Computing and Graphics division, AMD develops a range of products including x86 microprocessors (often as accelerated processing units), chipsets, and various graphics processing units (GPUs), encompassing discrete, integrated, data center, and professional variants, alongside providing development services. The Enterprise, Embedded and Semi-Custom segment focuses on server and embedded processors, bespoke System-on-Chip (SoC) products, and foundational technology for popular game consoles, also offering associated development support. AMD's diverse product lineup features processors for desktop and notebook personal computers under well-known brands such as AMD Ryzen, Ryzen PRO, Ryzen Threadripper, Threadripper PRO, AMD Athlon, Athlon PRO, AMD FX, AMD A-Series, and PRO A-Series. Discrete GPUs for these PCs are offered through the AMD Radeon graphics and AMD Embedded Radeon graphics brands, while professional graphics solutions include AMD Radeon Pro and AMD FirePro. Furthermore, the company provides high-performance accelerators for servers, including Radeon Instinct, Radeon PRO V-series, and AMD Instinct, along with AMD EPYC microprocessors designed for server environments. Its embedded processor solutions span multiple brands, such as AMD Athlon, AMD Geode, AMD Ryzen, AMD EPYC, AMD R-Series, and G-Series. AMD also produces chipsets under its own trademark and crafts customer-specific solutions leveraging its CPU, GPU, and multimedia expertise, including specialized semi-custom SoC products. AMD reaches its wide array of clients, which comprise original equipment manufacturers (OEMs), public cloud service providers, original design manufacturers (ODMs), system integrators, independent distributors, online retailers, and add-in-board manufacturers. The company's sales and distribution network includes its direct sales force, independent distributors, and dedicated sales representatives.
前收盤價
US$608.1
−US$12.58 · -2.03%
盤中時間採用ET。市場資料可能有所延遲。
Advanced Micro Devices, Inc. (AMD), established in 1969 and headquartered in Santa Clara, California, operates as a global leader in the semiconductor industry. The company organizes its extensive operations into two primary segments: Computing and Graphics, and Enterprise, Embedded and Semi-Custom. In its Computing and Graphics division, AMD develops a range of products including x86 microprocessors (often as accelerated processing units), chipsets, and various graphics processing units (GPUs), encompassing discrete, integrated, data center, and professional variants, alongside providing development services. The Enterprise, Embedded and Semi-Custom segment focuses on server and embedded processors, bespoke System-on-Chip (SoC) products, and foundational technology for popular game consoles, also offering associated development support. AMD's diverse product lineup features processors for desktop and notebook personal computers under well-known brands such as AMD Ryzen, Ryzen PRO, Ryzen Threadripper, Threadripper PRO, AMD Athlon, Athlon PRO, AMD FX, AMD A-Series, and PRO A-Series. Discrete GPUs for these PCs are offered through the AMD Radeon graphics and AMD Embedded Radeon graphics brands, while professional graphics solutions include AMD Radeon Pro and AMD FirePro. Furthermore, the company provides high-performance accelerators for servers, including Radeon Instinct, Radeon PRO V-series, and AMD Instinct, along with AMD EPYC microprocessors designed for server environments. Its embedded processor solutions span multiple brands, such as AMD Athlon, AMD Geode, AMD Ryzen, AMD EPYC, AMD R-Series, and G-Series. AMD also produces chipsets under its own trademark and crafts customer-specific solutions leveraging its CPU, GPU, and multimedia expertise, including specialized semi-custom SoC products. AMD reaches its wide array of clients, which comprise original equipment manufacturers (OEMs), public cloud service providers, original design manufacturers (ODMs), system integrators, independent distributors, online retailers, and add-in-board manufacturers. The company's sales and distribution network includes its direct sales force, independent distributors, and dedicated sales representatives.
日內區間
目前US$608.1
52週區間
目前US$608.1
盤中時間採用ET。市場資料可能有所延遲。
GoAI 評分
持有
估值
60
合理估值
情緒
54
多空交錯
風險
52
風險偏高
動能
64
動能增強
完整 GoAI 研究
繼續查看更深入的依據、催化因素和風險。
Advanced Micro Devices, Inc. (AMD), established in 1969 and headquartered in Santa Clara, California, operates as a global leader in the semiconductor industry. The company organizes its extensive operations into two primary segments: Computing and Graphics, and Enterprise, Embedded and Semi-Custom. In its Computing and Graphics division, AMD develops a range of products including x86 microprocessors (often as accelerated processing units), chipsets, and various graphics processing units (GPUs), encompassing discrete, integrated, data center, and professional variants, alongside providing development services. The Enterprise, Embedded and Semi-Custom segment focuses on server and embedded processors, bespoke System-on-Chip (SoC) products, and foundational technology for popular game consoles, also offering associated development support. AMD's diverse product lineup features processors for desktop and notebook personal computers under well-known brands such as AMD Ryzen, Ryzen PRO, Ryzen Threadripper, Threadripper PRO, AMD Athlon, Athlon PRO, AMD FX, AMD A-Series, and PRO A-Series. Discrete GPUs for these PCs are offered through the AMD Radeon graphics and AMD Embedded Radeon graphics brands, while professional graphics solutions include AMD Radeon Pro and AMD FirePro. Furthermore, the company provides high-performance accelerators for servers, including Radeon Instinct, Radeon PRO V-series, and AMD Instinct, along with AMD EPYC microprocessors designed for server environments. Its embedded processor solutions span multiple brands, such as AMD Athlon, AMD Geode, AMD Ryzen, AMD EPYC, AMD R-Series, and G-Series. AMD also produces chipsets under its own trademark and crafts customer-specific solutions leveraging its CPU, GPU, and multimedia expertise, including specialized semi-custom SoC products. AMD reaches its wide array of clients, which comprise original equipment manufacturers (OEMs), public cloud service providers, original design manufacturers (ODMs), system integrators, independent distributors, online retailers, and add-in-board manufacturers. The company's sales and distribution network includes its direct sales force, independent distributors, and dedicated sales representatives.
日內區間
目前US$608.1
52週區間
目前US$608.1
獲利能力占已公布營收的百分比。
營收
營業利益
淨利
| 項目(USD) | 2025會計年度 | 2024會計年度 | 2023會計年度 | 2022會計年度 | 2021會計年度 |
|---|---|---|---|---|---|
| 營收 | 346.39億 USD | 257.85億 USD | 226.8億 USD | 236.01億 USD | 164.34億 USD |
| 銷貨成本 | 174.87億 USD | 130.6億 USD | 122.2億 USD | 129.98億 USD | 85.05億 USD |
| 毛利 | 171.52億 USD | 127.25億 USD | 104.6億 USD | 106.03億 USD | 79.29億 USD |
| 研究與開發 | 80.91億 USD | 64.56億 USD | 58.72億 USD | 50.05億 USD | 28.45億 USD |
| 銷售、一般及管理費用 | 41.44億 USD | 27.83億 USD | 23.52億 USD | 23.36億 USD | 14.48億 USD |
| 營業費用 | 134.58億 USD | 108.25億 USD | 100.59億 USD | 93.39億 USD | 42.81億 USD |
| 利息收入 | 2.15億 USD | 1.82億 USD | 2.06億 USD | 6500萬 USD | 800萬 USD |
| 利息支出 | 1.31億 USD | 9200萬 USD | 1.06億 USD | 8800萬 USD | 3400萬 USD |
| 折舊和攤銷 | 30.04億 USD | 31.77億 USD | 35.51億 USD | 42.62億 USD | 4.63億 USD |
| 營業利益 | 36.94億 USD | 19億 USD | 4.01億 USD | 12.64億 USD | 36.48億 USD |
| 淨利 | 43.35億 USD | 16.41億 USD | 8.54億 USD | 13.2億 USD | 31.62億 USD |
公司資料更新於 2026年10月11日。
近期已公布業績
近期已公布業績
第三方分析師預期可能變動,並非 GoAI 建議。
平均目標
US$607.59
下跌空間 0.08%| 行動 | 除息日 | 詳情 | 記錄日期 | 付款日期 |
|---|---|---|---|---|
股息 | 1995年4月27日 | US$0.01Annual | 1995年5月3日 | 1995年5月24日 |
除息 1995年4月27日
US$0.01
Annual
1995年5月3日登記 · 支付日 1995年5月24日
報告持有此股票曝險的交易所交易基金。
 State Street SPDR S&P 500 ETF1557.T1.96兆1.51%129.35兆 JPY0.09%¥122,850+0.12%
 Vanguard Morningstar Total Stock Market ETFVTI243.93億1.04%2.3兆 USD0.03%US$381.94+0.63%
 Invesco QQQ Trust, Series 1QQQ207.08億4.09%5060.67億 USD0.18%US$751.27+0.49%
 Vanguard S&P 500 ETFVOO203.92億1.16%1.8兆 USD0.03%US$715.59+0.61%
 iShares Core S&P 500 ETFIVV134.69億1.51%8964.4億 USD0.03%US$781.97+0.60%
 State Street SPDR S&P 500 ETFSPY123.77億1.51%8172億 USD0.09%US$778.57+0.60%
 Vanguard Morningstar Growth ETFVUG79.74億2.07%3846億 USD0.03%US$91.97+0.72%
 State Street Technology Select Sector SPDR ETFXLK66.08億5.07%1303.13億 USD0.08%US$198.78+0.51%State Street SPDR S&P 500 ETF1557.TVanguard Morningstar Total Stock Market ETFVTIInvesco QQQ Trust, Series 1QQQVanguard S&P 500 ETFVOOiShares Core S&P 500 ETFIVVState Street SPDR S&P 500 ETFSPYVanguard Morningstar Growth ETFVUGState Street Technology Select Sector SPDR ETFXLK
AI 生成內容及延遲市場資料僅供資訊與教育用途,不構成投資建議。