載入中
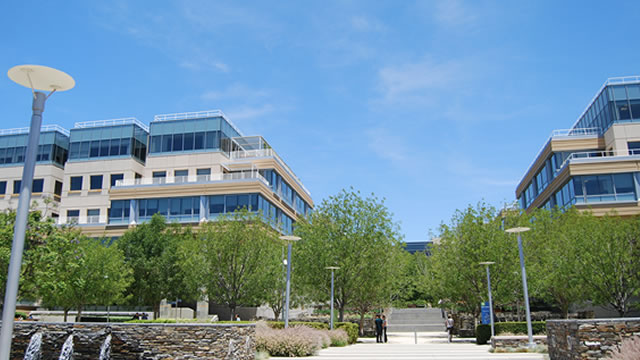
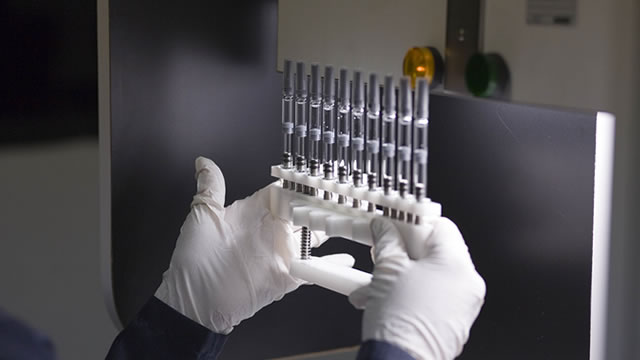
Amgen Inc., established in 1980 and headquartered in Thousand Oaks, California, is a global biotechnology leader focused on discovering, developing, manufacturing, and delivering groundbreaking human medicines. The company's scientific endeavors span several critical therapeutic categories, including inflammatory conditions, oncology and hematology, bone health, cardiovascular diseases, nephrology, and neuroscience. Its extensive portfolio features a range of significant pharmaceutical products. Notable examples include Enbrel, prescribed for conditions like plaque psoriasis, rheumatoid arthritis, and psoriatic arthritis; Neulasta, which helps cancer patients by reducing the risk of infection linked to a low white blood cell count; Prolia, utilized in postmenopausal women to combat osteoporosis; and Xgeva, designed to prevent skeletal-related complications. Otezla offers relief for adult patients suffering from plaque psoriasis, psoriatic arthritis, and oral ulcers associated with Behçet's disease. Aranesp addresses anemia and low red blood cell counts, while KYPROLIS is employed to treat patients with relapsed or refractory multiple myeloma. Furthermore, Repatha plays a vital role in lowering the incidence of major cardiovascular events such as myocardial infarction, stroke, and coronary revascularization. Amgen's comprehensive product lineup also encompasses Nplate, Vectibix, MVASI, Parsabiv, EPOGEN, KANJINTI, BLINCYTO, Aimovig, EVENITY, AMGEVITATM, Sensipar/Mimpara, NEUPOGEN, IMLYGIC, Corlanor, and AVSOLA. The company distributes its therapies worldwide, primarily serving healthcare providers, including physicians and their clinics, dialysis centers, hospitals, and pharmacies. Distribution is facilitated through pharmaceutical wholesale distributors, complemented by direct-to-consumer channels. Amgen actively engages in strategic collaborations. It has partnered with entities such as Novartis Pharma AG, UCB, Bayer HealthCare LLC, BeiGene, Ltd., Eli Lilly and Company, Datos Health, and Verastem, Inc., to jointly assess VS-6766 when combined with lumakrastm (Sotorasib) in patients with KRAS G12C-mutant non-small cell lung cancer. Another key alliance involves Kyowa Kirin Co., Ltd., for the co-development and commercialization of KHK4083, a Phase 3-ready anti-OX40 fully human monoclonal antibody targeting atopic dermatitis and other autoimmune conditions. Additionally, Amgen maintains research and development partnerships with Neumora Therapeutics, Inc. and Plexium, Inc.
前收盤價
US$413.08
+US$10.48 · +2.60%
盤後
US$412.7
−US$0.38 · -0.09%
10月7日 下午7:56 ET
盤中時間採用ET。市場資料可能有所延遲。
Amgen Inc., established in 1980 and headquartered in Thousand Oaks, California, is a global biotechnology leader focused on discovering, developing, manufacturing, and delivering groundbreaking human medicines. The company's scientific endeavors span several critical therapeutic categories, including inflammatory conditions, oncology and hematology, bone health, cardiovascular diseases, nephrology, and neuroscience. Its extensive portfolio features a range of significant pharmaceutical products. Notable examples include Enbrel, prescribed for conditions like plaque psoriasis, rheumatoid arthritis, and psoriatic arthritis; Neulasta, which helps cancer patients by reducing the risk of infection linked to a low white blood cell count; Prolia, utilized in postmenopausal women to combat osteoporosis; and Xgeva, designed to prevent skeletal-related complications. Otezla offers relief for adult patients suffering from plaque psoriasis, psoriatic arthritis, and oral ulcers associated with Behçet's disease. Aranesp addresses anemia and low red blood cell counts, while KYPROLIS is employed to treat patients with relapsed or refractory multiple myeloma. Furthermore, Repatha plays a vital role in lowering the incidence of major cardiovascular events such as myocardial infarction, stroke, and coronary revascularization. Amgen's comprehensive product lineup also encompasses Nplate, Vectibix, MVASI, Parsabiv, EPOGEN, KANJINTI, BLINCYTO, Aimovig, EVENITY, AMGEVITATM, Sensipar/Mimpara, NEUPOGEN, IMLYGIC, Corlanor, and AVSOLA. The company distributes its therapies worldwide, primarily serving healthcare providers, including physicians and their clinics, dialysis centers, hospitals, and pharmacies. Distribution is facilitated through pharmaceutical wholesale distributors, complemented by direct-to-consumer channels. Amgen actively engages in strategic collaborations. It has partnered with entities such as Novartis Pharma AG, UCB, Bayer HealthCare LLC, BeiGene, Ltd., Eli Lilly and Company, Datos Health, and Verastem, Inc., to jointly assess VS-6766 when combined with lumakrastm (Sotorasib) in patients with KRAS G12C-mutant non-small cell lung cancer. Another key alliance involves Kyowa Kirin Co., Ltd., for the co-development and commercialization of KHK4083, a Phase 3-ready anti-OX40 fully human monoclonal antibody targeting atopic dermatitis and other autoimmune conditions. Additionally, Amgen maintains research and development partnerships with Neumora Therapeutics, Inc. and Plexium, Inc.
日內區間
目前US$413.08
52週區間
目前US$413.08
盤中時間採用ET。市場資料可能有所延遲。
Amgen Inc., established in 1980 and headquartered in Thousand Oaks, California, is a global biotechnology leader focused on discovering, developing, manufacturing, and delivering groundbreaking human medicines. The company's scientific endeavors span several critical therapeutic categories, including inflammatory conditions, oncology and hematology, bone health, cardiovascular diseases, nephrology, and neuroscience. Its extensive portfolio features a range of significant pharmaceutical products. Notable examples include Enbrel, prescribed for conditions like plaque psoriasis, rheumatoid arthritis, and psoriatic arthritis; Neulasta, which helps cancer patients by reducing the risk of infection linked to a low white blood cell count; Prolia, utilized in postmenopausal women to combat osteoporosis; and Xgeva, designed to prevent skeletal-related complications. Otezla offers relief for adult patients suffering from plaque psoriasis, psoriatic arthritis, and oral ulcers associated with Behçet's disease. Aranesp addresses anemia and low red blood cell counts, while KYPROLIS is employed to treat patients with relapsed or refractory multiple myeloma. Furthermore, Repatha plays a vital role in lowering the incidence of major cardiovascular events such as myocardial infarction, stroke, and coronary revascularization. Amgen's comprehensive product lineup also encompasses Nplate, Vectibix, MVASI, Parsabiv, EPOGEN, KANJINTI, BLINCYTO, Aimovig, EVENITY, AMGEVITATM, Sensipar/Mimpara, NEUPOGEN, IMLYGIC, Corlanor, and AVSOLA. The company distributes its therapies worldwide, primarily serving healthcare providers, including physicians and their clinics, dialysis centers, hospitals, and pharmacies. Distribution is facilitated through pharmaceutical wholesale distributors, complemented by direct-to-consumer channels. Amgen actively engages in strategic collaborations. It has partnered with entities such as Novartis Pharma AG, UCB, Bayer HealthCare LLC, BeiGene, Ltd., Eli Lilly and Company, Datos Health, and Verastem, Inc., to jointly assess VS-6766 when combined with lumakrastm (Sotorasib) in patients with KRAS G12C-mutant non-small cell lung cancer. Another key alliance involves Kyowa Kirin Co., Ltd., for the co-development and commercialization of KHK4083, a Phase 3-ready anti-OX40 fully human monoclonal antibody targeting atopic dermatitis and other autoimmune conditions. Additionally, Amgen maintains research and development partnerships with Neumora Therapeutics, Inc. and Plexium, Inc.
日內區間
目前US$413.08
52週區間
目前US$413.08
近期已公布業績
近期已公布業績
第三方分析師預期可能變動,並非 GoAI 建議。
年度分割調整後的每股現金分配。
US$9.52
2025年(完整年度)+35.2% 自從 2021
2026年(部分年度):US$7.56
US$7.04
2,021
US$7.76
2,022
US$8.52
2,023
US$9.00
2,024
US$9.52
2,025
US$7.56
2,026*
* 在現有股息歷史記錄中,該日曆年僅包含部分期間。
| 行動 | 除息日 | 詳情 | 記錄日期 | 付款日期 |
|---|---|---|---|---|
股息 | 2026年8月21日 | US$2.52Quarterly | 2026年8月21日 | 2026年9月11日 |
股息 | 2026年5月15日 | US$2.52Quarterly | 2026年5月15日 | 2026年6月5日 |
股息 | 2026年2月13日 | US$2.52Quarterly | 2026年2月13日 | 2026年3月6日 |
股息 | 2025年11月21日 | US$2.38Quarterly | 2025年11月21日 | 2025年12月12日 |
股息 | 2025年8月22日 | US$2.38Quarterly | 2025年8月22日 | 2025年9月12日 |
股息 | 2025年5月16日 | US$2.38Quarterly | 2025年5月16日 | 2025年6月6日 |
除息 2026年8月21日
US$2.52
Quarterly
2026年8月21日登記 · 支付日 2026年9月11日
除息 2026年5月15日
US$2.52
Quarterly
2026年5月15日登記 · 支付日 2026年6月5日
除息 2026年2月13日
US$2.52
Quarterly
2026年2月13日登記 · 支付日 2026年3月6日
除息 2025年11月21日
US$2.38
Quarterly
2025年11月21日登記 · 支付日 2025年12月12日
除息 2025年8月22日
US$2.38
Quarterly
2025年8月22日登記 · 支付日 2025年9月12日
除息 2025年5月16日
US$2.38
Quarterly
2025年5月16日登記 · 支付日 2025年6月6日
報告持有此股票曝險的交易所交易基金。
 State Street SPDR S&P 500 ETF1557.T4185.86億0.32%129.41兆 JPY0.09%¥122,700-0.57%
 Vanguard Morningstar Total Stock Market ETFVTI73.74億0.31%2.3兆 USD0.03%US$381.03-0.40%
 Vanguard S&P 500 ETFVOO61.65億0.35%1.8兆 USD0.03%US$714.34-0.26%
 Invesco QQQ Trust, Series 1QQQ45.12億0.89%5084.84億 USD0.18%US$757.73-0.25%
 Schwab U.S. Dividend Equity ETFSCHD41.8億3.85%1092.1億 USD0.06%US$32.65-0.62%
 iShares Core S&P 500 ETFIVV28.99億0.32%8996.25億 USD0.03%US$780.58-0.25%
 State Street SPDR S&P 500 ETFSPY26.43億0.32%8190.39億 USD0.09%US$777.22-0.24%
 Vanguard Morningstar Value ETFVTV22.17億0.84%2624億 USD0.03%US$218.21-0.37%State Street SPDR S&P 500 ETF1557.TVanguard Morningstar Total Stock Market ETFVTIVanguard S&P 500 ETFVOOInvesco QQQ Trust, Series 1QQQSchwab U.S. Dividend Equity ETFSCHDiShares Core S&P 500 ETFIVVState Street SPDR S&P 500 ETFSPYVanguard Morningstar Value ETFVTV
AI 生成內容及延遲市場資料僅供資訊與教育用途,不構成投資建議。