載入中

NASDAQConsumer CyclicalAuto - Manufacturers
最新資料
US$0.609
−US$0.0269 · -4.23%
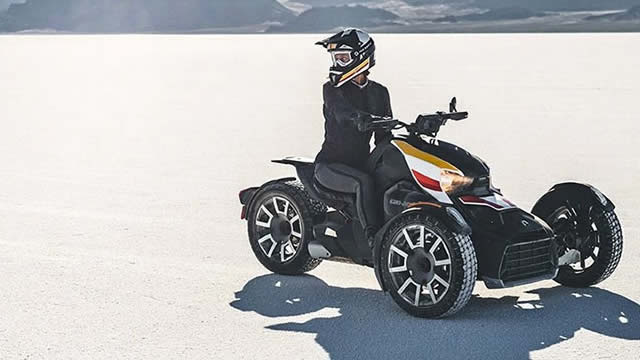
Kandi Technologies Group, Inc. is an enterprise focused on the entire lifecycle—from conceptualization and engineering to manufacturing and market distribution—of electric vehicles (EVs) and their crucial components, as well as a diverse range of off-road vehicles. The company conducts its operations both within the People's Republic of China and internationally. Its offerings include various off-road transportation options such as all-terrain vehicles (ATVs), utility vehicles (UTVs), go-karts, electric scooters, and self-balancing electric scooters, along with their related accessories. For electric vehicles, Kandi also supplies essential parts like battery packs, structural body elements, EV control systems, climate control units, and numerous other automotive components. Established in 2002, the firm was formerly known as Kandi Technologies, Corp., before rebranding to Kandi Technologies Group, Inc. in December 2012. Its corporate headquarters are situated in Jinhua, People's Republic of China.
前收盤價
US$0.609
−US$0.0269 · -4.23%
盤前
US$0.57
−US$0.039 · -6.40%
10月12日 上午6:00 ET
盤中時間採用ET。市場資料可能有所延遲。
Kandi Technologies Group, Inc. is an enterprise focused on the entire lifecycle—from conceptualization and engineering to manufacturing and market distribution—of electric vehicles (EVs) and their crucial components, as well as a diverse range of off-road vehicles. The company conducts its operations both within the People's Republic of China and internationally. Its offerings include various off-road transportation options such as all-terrain vehicles (ATVs), utility vehicles (UTVs), go-karts, electric scooters, and self-balancing electric scooters, along with their related accessories. For electric vehicles, Kandi also supplies essential parts like battery packs, structural body elements, EV control systems, climate control units, and numerous other automotive components. Established in 2002, the firm was formerly known as Kandi Technologies, Corp., before rebranding to Kandi Technologies Group, Inc. in December 2012. Its corporate headquarters are situated in Jinhua, People's Republic of China.
日內區間
目前US$0.609
52週區間
目前US$0.609
盤中時間採用ET。市場資料可能有所延遲。
GoAI 評分
賣出
估值
47
合理估值
情緒
60
多空交錯
風險
68
高風險
動能
25
動能減弱
完整 GoAI 研究
繼續查看更深入的依據、催化因素和風險。
Kandi Technologies Group, Inc. is an enterprise focused on the entire lifecycle—from conceptualization and engineering to manufacturing and market distribution—of electric vehicles (EVs) and their crucial components, as well as a diverse range of off-road vehicles. The company conducts its operations both within the People's Republic of China and internationally. Its offerings include various off-road transportation options such as all-terrain vehicles (ATVs), utility vehicles (UTVs), go-karts, electric scooters, and self-balancing electric scooters, along with their related accessories. For electric vehicles, Kandi also supplies essential parts like battery packs, structural body elements, EV control systems, climate control units, and numerous other automotive components. Established in 2002, the firm was formerly known as Kandi Technologies, Corp., before rebranding to Kandi Technologies Group, Inc. in December 2012. Its corporate headquarters are situated in Jinhua, People's Republic of China.
日內區間
目前US$0.609
52週區間
目前US$0.609
獲利能力占已公布營收的百分比。
營收
營業利益
淨利
| 項目(USD) | 2025會計年度 | 2024會計年度 | 2023會計年度 | 2022會計年度 | 2021會計年度 |
|---|---|---|---|---|---|
| 營收 | 8744萬 USD | 1.28億 USD | 1.24億 USD | 1.18億 USD | 9148.64萬 USD |
| 銷貨成本 | 5014.83萬 USD | 8829.92萬 USD | 8222.92萬 USD | 9829.53萬 USD | 7523.85萬 USD |
| 毛利 | 3729.17萬 USD | 3927.04萬 USD | 4137萬 USD | 1951.77萬 USD | 1624.79萬 USD |
| 研究與開發 | 762.16萬 USD | 499.59萬 USD | 426.52萬 USD | 602.96萬 USD | 3897.2萬 USD |
| 銷售、一般及管理費用 | 7106.7萬 USD | 7892.11萬 USD | 4871.74萬 USD | 3782.74萬 USD | 2434.15萬 USD |
| 營業費用 | 7868.86萬 USD | 1.08億 USD | 5442.22萬 USD | 4719.72萬 USD | 1491.17萬 USD |
| 利息收入 | 869.09萬 USD | 1004.6萬 USD | 998.5萬 USD | 642.8萬 USD | 420.9萬 USD |
| 利息支出 | 188.63萬 USD | 219.6萬 USD | 132.7萬 USD | 70.75萬 USD | 40.76萬 USD |
| 折舊和攤銷 | 570.16萬 USD | 1202.1萬 USD | 1191.36萬 USD | 1242.8萬 USD | 1003.9萬 USD |
| 營業利益 | −4139.69萬 USD | −6878.19萬 USD | −1305.22萬 USD | −2767.94萬 USD | 133.62萬 USD |
| 淨利 | −9388.4萬 USD | −5049.57萬 USD | 7132 USD | −1212.37萬 USD | 2286.38萬 USD |
公司資料更新於 2026年10月12日。
近期已公布業績
近期已公布業績
報告持有此股票曝險的交易所交易基金。
AI 生成內容及延遲市場資料僅供資訊與教育用途,不構成投資建議。