載入中

NASDAQFinancial ServicesFinancial - Credit Services
最新資料
US$55.53
+US$0.51 · +0.93%
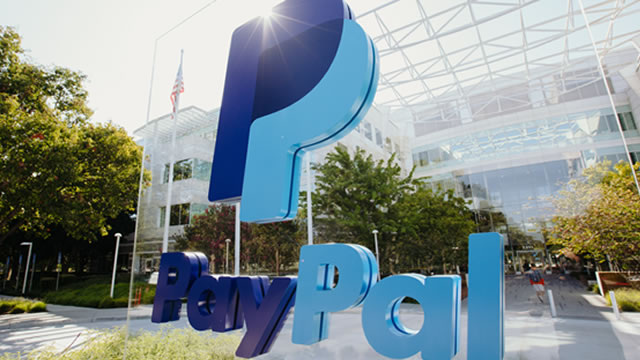
PayPal Holdings, Inc. provides a worldwide technological framework that facilitates digital financial transactions for both businesses and individual users. The company offers a wide array of payment services through well-known brands such as PayPal, PayPal Credit, Braintree, Venmo, Xoom, Zettle, Hyperwallet, Honey, and Paidy. Through its extensive platform, consumers are able to send and receive funds across roughly 200 global markets and in approximately 100 different currencies. Additionally, users can transfer money to their bank accounts in 56 currencies and maintain account balances in 25 distinct currencies within their PayPal accounts. Founded in 1998, the company's corporate headquarters are situated in San Jose, California.
前收盤價
US$55.53
+US$0.51 · +0.93%
盤中時間採用ET。市場資料可能有所延遲。
PayPal Holdings, Inc. provides a worldwide technological framework that facilitates digital financial transactions for both businesses and individual users. The company offers a wide array of payment services through well-known brands such as PayPal, PayPal Credit, Braintree, Venmo, Xoom, Zettle, Hyperwallet, Honey, and Paidy. Through its extensive platform, consumers are able to send and receive funds across roughly 200 global markets and in approximately 100 different currencies. Additionally, users can transfer money to their bank accounts in 56 currencies and maintain account balances in 25 distinct currencies within their PayPal accounts. Founded in 1998, the company's corporate headquarters are situated in San Jose, California.
日內區間
目前US$55.53
52週區間
目前US$55.53
盤中時間採用ET。市場資料可能有所延遲。
GoAI 評分
買進
估值
100
深度低估
情緒
65
看漲
風險
47
風險偏高
動能
38
動能減弱
完整 GoAI 研究
繼續查看更深入的依據、催化因素和風險。
PayPal Holdings, Inc. provides a worldwide technological framework that facilitates digital financial transactions for both businesses and individual users. The company offers a wide array of payment services through well-known brands such as PayPal, PayPal Credit, Braintree, Venmo, Xoom, Zettle, Hyperwallet, Honey, and Paidy. Through its extensive platform, consumers are able to send and receive funds across roughly 200 global markets and in approximately 100 different currencies. Additionally, users can transfer money to their bank accounts in 56 currencies and maintain account balances in 25 distinct currencies within their PayPal accounts. Founded in 1998, the company's corporate headquarters are situated in San Jose, California.
日內區間
目前US$55.53
52週區間
目前US$55.53
獲利能力占已公布營收的百分比。
營收
營業利益
淨利
| 項目(USD) | 2025會計年度 | 2024會計年度 | 2023會計年度 | 2022會計年度 | 2021會計年度 |
|---|---|---|---|---|---|
| 營收 | 331.72億 USD | 317.97億 USD | 297.71億 USD | 275.18億 USD | 253.71億 USD |
| 銷貨成本 | 177.07億 USD | 171.39億 USD | 160.67億 USD | 137.45億 USD | 113.75億 USD |
| 毛利 | 154.65億 USD | 146.58億 USD | 137.04億 USD | 137.73億 USD | 139.96億 USD |
| 研究與開發 | 31.03億 USD | 29.79億 USD | 29.73億 USD | 32.53億 USD | 30.38億 USD |
| 銷售、一般及管理費用 | 42.62億 USD | 41.48億 USD | 38.68億 USD | 43.56億 USD | 45.59億 USD |
| 營業費用 | 94億 USD | 93.33億 USD | 86.76億 USD | 99.36億 USD | 97.34億 USD |
| 利息收入 | 5.17億 USD | 6.62億 USD | 4.8億 USD | 1.74億 USD | 5700萬 USD |
| 利息支出 | 4.41億 USD | 3.82億 USD | 3.47億 USD | 3.04億 USD | 2.32億 USD |
| 折舊和攤銷 | 9.63億 USD | 10.32億 USD | 10.72億 USD | 13.17億 USD | 12.65億 USD |
| 營業利益 | 60.65億 USD | 53.25億 USD | 50.28億 USD | 38.37億 USD | 42.62億 USD |
| 淨利 | 52.33億 USD | 41.47億 USD | 42.46億 USD | 24.19億 USD | 41.69億 USD |
公司資料更新於 2026年10月11日。
近期已公布業績
近期已公布業績
第三方分析師預期可能變動,並非 GoAI 建議。
平均目標
US$56.41
上漲空間 1.58%| 行動 | 除息日 | 詳情 | 記錄日期 | 付款日期 |
|---|---|---|---|---|
股息 | 2026年9月4日 | US$0.14Quarterly | 2026年9月4日 | 2026年9月25日 |
股息 | 2026年6月4日 | US$0.14Quarterly | 2026年6月4日 | 2026年6月25日 |
股息 | 2026年3月4日 | US$0.14Quarterly | 2026年3月4日 | 2026年3月25日 |
股息 | 2025年11月19日 | US$0.14Quarterly | 2025年11月19日 | 2025年12月10日 |
除息 2026年9月4日
US$0.14
Quarterly
2026年9月4日登記 · 支付日 2026年9月25日
除息 2026年6月4日
US$0.14
Quarterly
2026年6月4日登記 · 支付日 2026年6月25日
除息 2026年3月4日
US$0.14
Quarterly
2026年3月4日登記 · 支付日 2026年3月25日
除息 2025年11月19日
US$0.14
Quarterly
2025年11月19日登記 · 支付日 2025年12月10日
報告持有此股票曝險的交易所交易基金。
 State Street SPDR S&P 500 ETF1557.T906.87億0.07%129.35兆 JPY0.09%¥122,850+0.12%
 Vanguard Morningstar Total Stock Market ETFVTI13.28億0.06%2.3兆 USD0.03%US$381.94+0.63%
 Vanguard S&P 500 ETFVOO11.12億0.06%1.8兆 USD0.03%US$715.59+0.61%
 Invesco QQQ Trust, Series 1QQQ9.91億0.20%5060.67億 USD0.18%US$751.27+0.49%
 iShares Core S&P 500 ETFIVV6.26億0.07%8964.4億 USD0.03%US$781.97+0.60%
 Vanguard Morningstar Mid-Cap ETFVO6.12億0.27%2264億 USD0.03%US$81.14+0.92%
 State Street SPDR S&P 500 ETFSPY5.73億0.07%8172億 USD0.09%US$778.57+0.60%
 First Trust Rising Dividend Achievers ETFRDVY4.34億1.70%254.74億 USD0.47%US$79.58+0.19%State Street SPDR S&P 500 ETF1557.TVanguard Morningstar Total Stock Market ETFVTIVanguard S&P 500 ETFVOOInvesco QQQ Trust, Series 1QQQiShares Core S&P 500 ETFIVVVanguard Morningstar Mid-Cap ETFVOState Street SPDR S&P 500 ETFSPYFirst Trust Rising Dividend Achievers ETFRDVY
AI 生成內容及延遲市場資料僅供資訊與教育用途,不構成投資建議。