
Bitcoin Set to Rise Beyond $70,000 in 'Coming Weeks,' Experts Say

Go Wire
October 17, 2024
GoGPT Summarizes Articles

Cryptocurrency Overview:
- Bitcoin: The leading cryptocurrency, designed for decentralized financial transactions.
- Altcoins: Any cryptocurrency other than Bitcoin, with Ethereum being a significant player.
- Litecoin: Considered one of the first altcoins, forked from Bitcoin.
- Stablecoins: Cryptocurrencies pegged to stable assets like the USD to reduce volatility.
- Bitcoin Dominance: Ratio of Bitcoin's market cap to total crypto market cap, indicating investor interest.
Bitcoin successfully closed above the $66,000 resistance, signaling a potential uptrend ahead. Ethereum rebounded from the support level of $2,542, indicating a possible upward movement. Ripple approached the 200-day EMA at $0.553; closing above it suggests a potential price rebound. Bitcoin (BTC) and Ethereum (ETH) have established strong support at key levels, indicating a potential uptrend. In contrast, Ripple (XRP) is nearing a crucial resistance level, hinting at a breakout that could bring upward momentum in the coming days.
Bitcoin shows signs of bullish strength as its price surged above the $66,000 resistance on Tuesday and rose by 2.42% before Wednesday. As of Thursday, Bitcoin's price hovered around $67,600.

The Moving Average Convergence Divergence (MACD) indicator on the daily chart confirmed a bullish crossover on Monday, further supporting Bitcoin's upward movement. The MACD line (blue) moved above the signal line (yellow), issuing a buy signal. It also showed the green histogram rising above the neutral zero line, indicating strengthening upward momentum.
Moreover, the Relative Strength Index (RSI) on the daily chart indicated that Bitcoin was nearing overbought levels, with a trading price of 67 close to the overbought level of 70. If it enters this region at the close, traders are advised not to increase long positions as a pullback becomes more likely. However, another scenario could see the uptrend continue with the RSI staying in the overbought zone. If it enters overbought territory and then retraces back below 70 to the neutral 50 level, this would signal a deeper correction.
If the $66,000 level holds as support, Bitcoin is likely to continue its upward trajectory, retesting the high of $70,079 from July 29.
However, failure to find support near $66,000 and closing below that level could lead to a 6% decline for Bitcoin, retesting the support level at $62,000, which aligns with the 61.8% Fibonacci retracement level of $62,059 (drawn from the high of $70,079 in July to the low of $49,084 in August).
Ethereum's price demonstrates potential for an upward move as it broke above the daily resistance at $2,461 on Monday, rising by 6.5% and closing well above the 50-day Exponential Moving Average (EMA). On Tuesday, Ethereum dipped to test and found support near the 50-day EMA at $2,542. As of Thursday, Ethereum's price was trading around $2,600.
The MACD indicator supports a bullish view for Ethereum, issuing a bullish crossover signal on the daily chart. On Monday, the MACD line moved above the signal line, signaling a buy. It displayed a continuously rising green histogram above the neutral zero line, hinting at potential upward momentum for Ethereum.
Furthermore, the Relative Strength Index on the daily chart traded at 61, above the neutral 50 level, indicating strengthening bullish momentum.
If the 50-day EMA at $2,542 continues to act as support, Ethereum may continue its uptrend, retesting the high of $2,820 from August 24.
On the other hand, if Ethereum's price closes below the daily support level at $2,461, it could extend its decline by 13%, retesting the low of $2,150 from September 6.
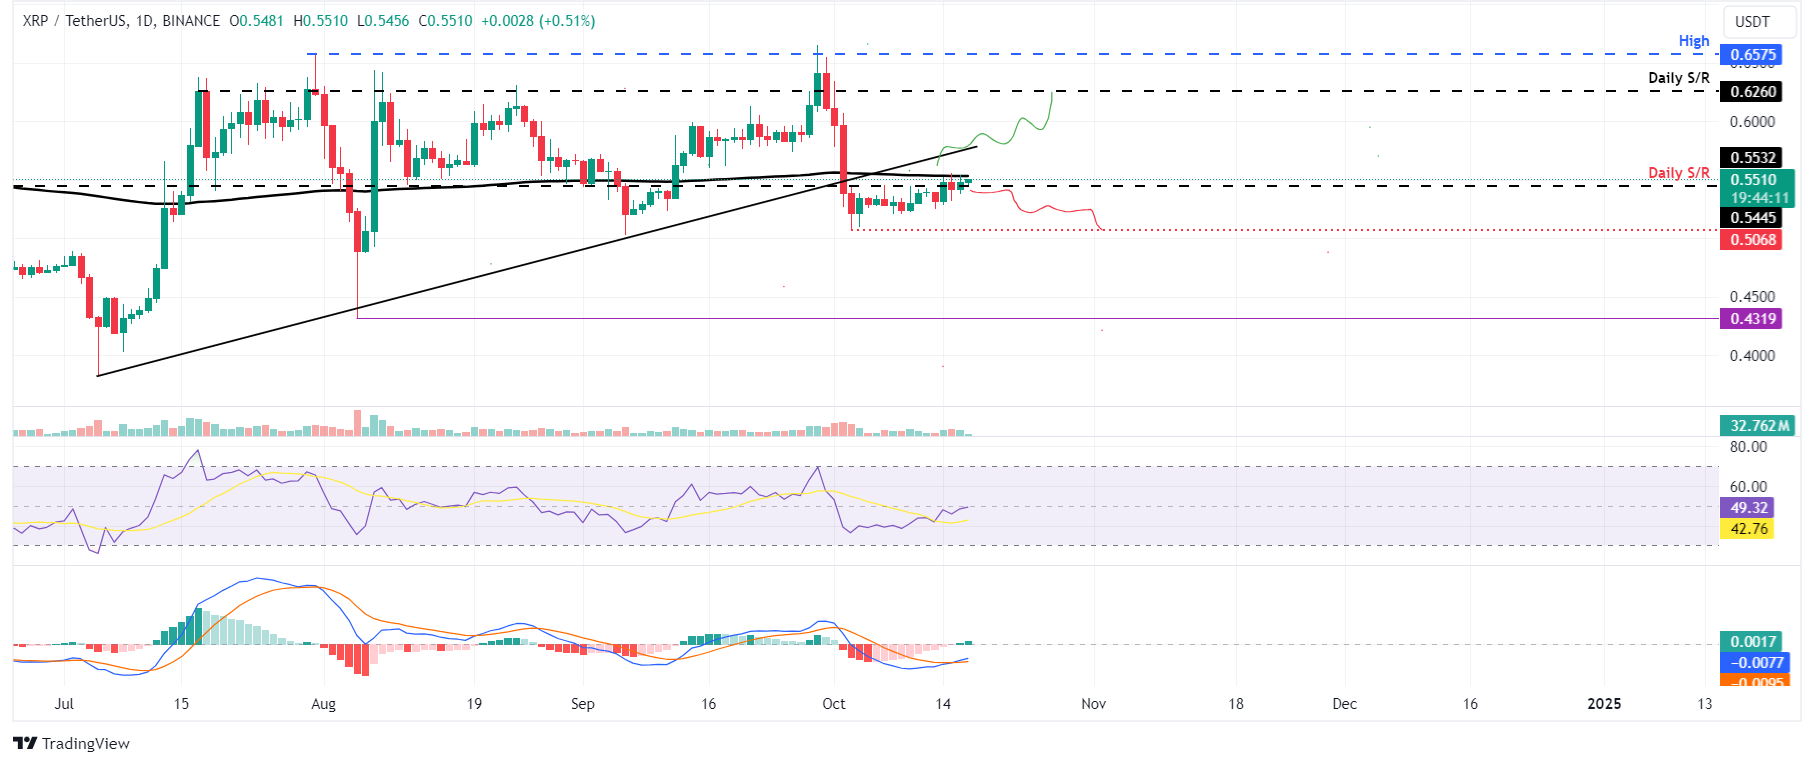
If Ripple's price closes above the 200-day EMA at $0.553, it may experience an uptrend. Since Monday, the price of Ripple has been repeatedly rejected near its 200-day EMA of $0.553. As of Thursday, it was trading around $0.551, close to the 200-day EMA at $0.553.
If XRP breaks above the 200-day EMA at $0.553 and closes, it could rise by over 13%, retesting the next daily resistance level at $0.626.
On Wednesday, the MACD indicator flipped bullish on the daily chart. The MACD line moved above the signal line, issuing a buy signal. This indicates that bullish momentum is in control and an upward movement may occur.
Additionally, the Relative Strength Index on the daily chart was trading at 49, close to the neutral 50 level. For bullish momentum to gain traction, the RSI must trade above the neutral level.
However, if Ripple's price fails to close above $0.553 and closes below the daily resistance level at $0.544, it could lead to a decline, retesting the low of $0.506 from October 3.
#bitcoin