
How to Read an Earnings Report: Using Apple as an Example (Part 2)


In the previous article, we explored what earnings reports are, why they matter, and the key components to focus on. Now, let's break down the essential elements of an earnings report using Apple Inc.'s most recent 10-Q as our example, equipping you with the skills to interpret them like a seasoned pro.
Where to Find Earnings Reports?
Earnings reports are publicly available documents filed with the Securities and Exchange Commission (SEC). You can find them on the company's investor relations website or on financial news platforms that track corporate filings. For Apple, their quarterly reports are typically found on the Apple Investor Relations page.
The Anatomy of an Earnings Report
1. The Basics: Net Sales
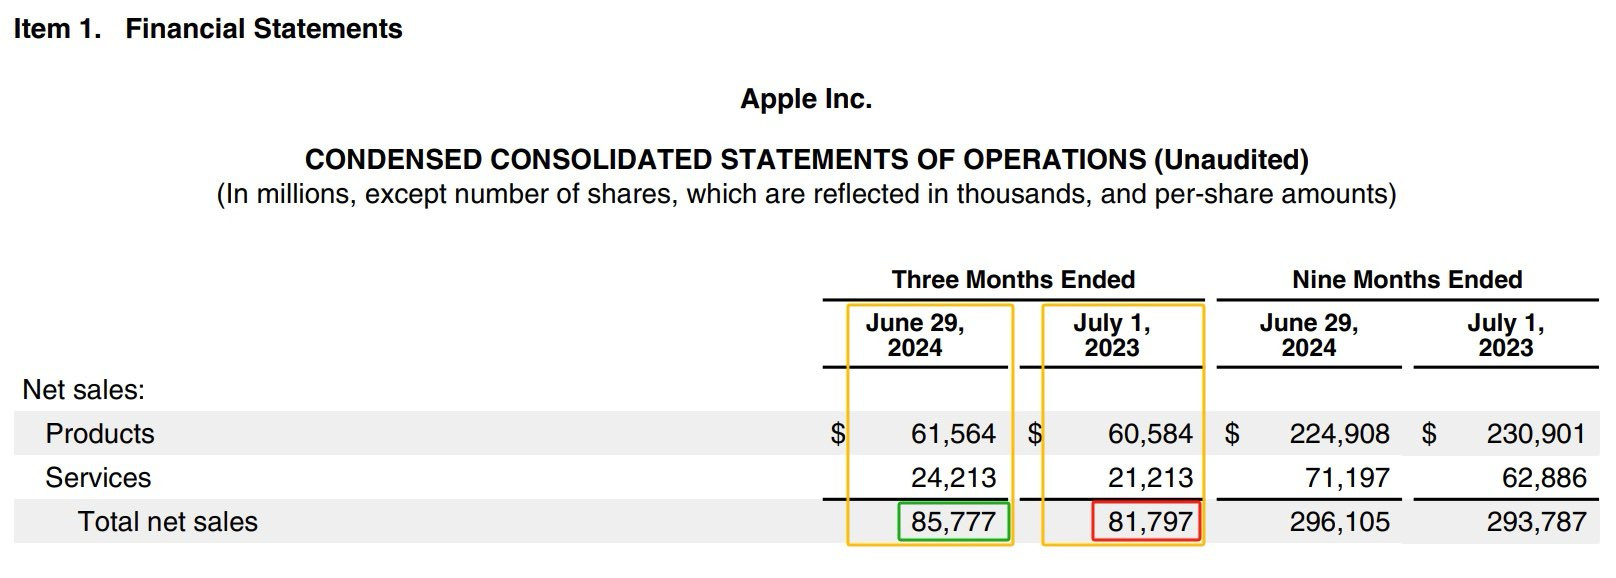
Every earnings report begins with net sales, which can be calculated as:
Net Sales= Gross Sales - Returns - Allowances - Discounts
This figure represents everything the company sold, adjusted for returns, allowances, and discounts. A higher net sales figure generally indicates strong demand for the company's products, while a decline could suggest weakening sales or market challenges.
For example, Apple's 2024 Q2 total net sales were $85,777, up from $81,797 in the same quarter last year. This increase suggests strong market demand and growth.
2. Cost of Sales
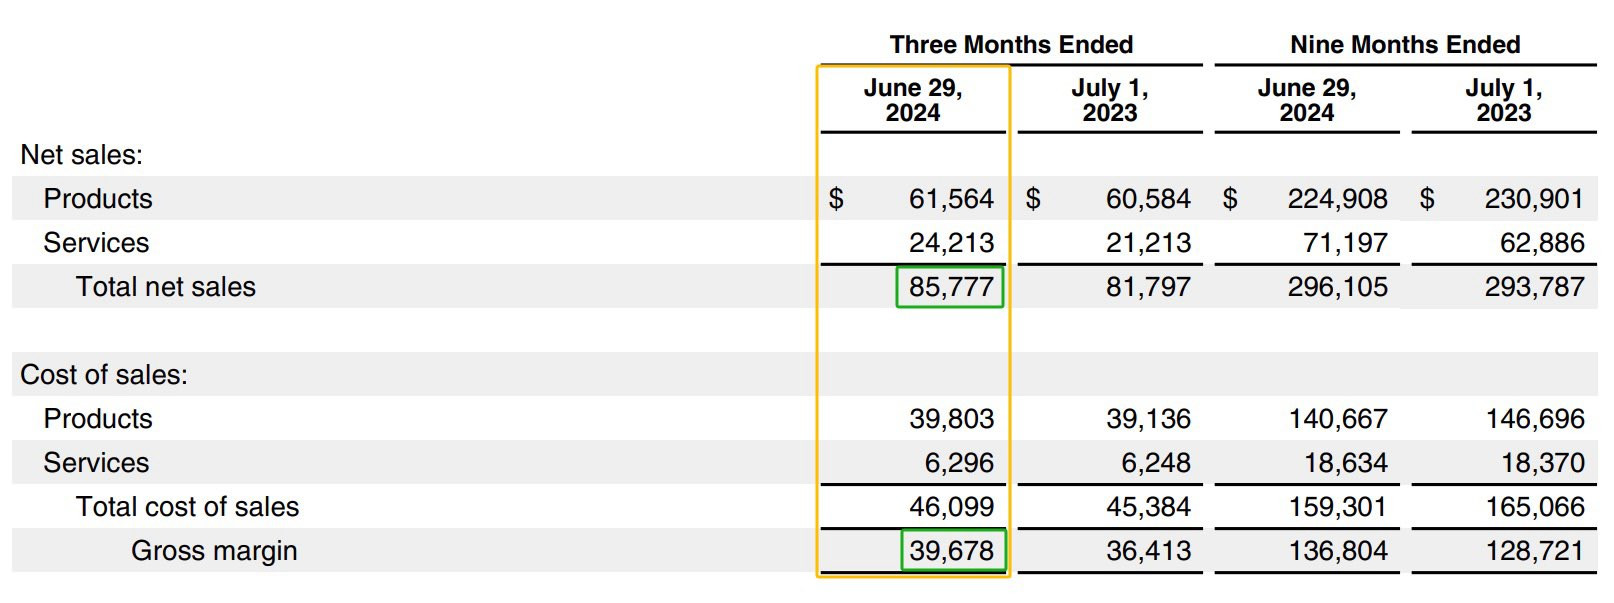
Next, we analyze the cost of sales (or cost of goods sold). This includes all expenses related to producing the product or service, such as raw materials and labor. Subtracting these costs from net sales gives you the gross margin:
Gross Margin = Net Sales - Cost of Sales
You can also calculate the gross margin percentage:
Gross Margin Percentage = (Gross Margin / Net Sales) * 100%
A high gross margin indicates that a company is effectively managing production costs relative to sales, signaling operational efficiency. Conversely, a declining gross margin percentage may indicate rising costs or pricing pressure.
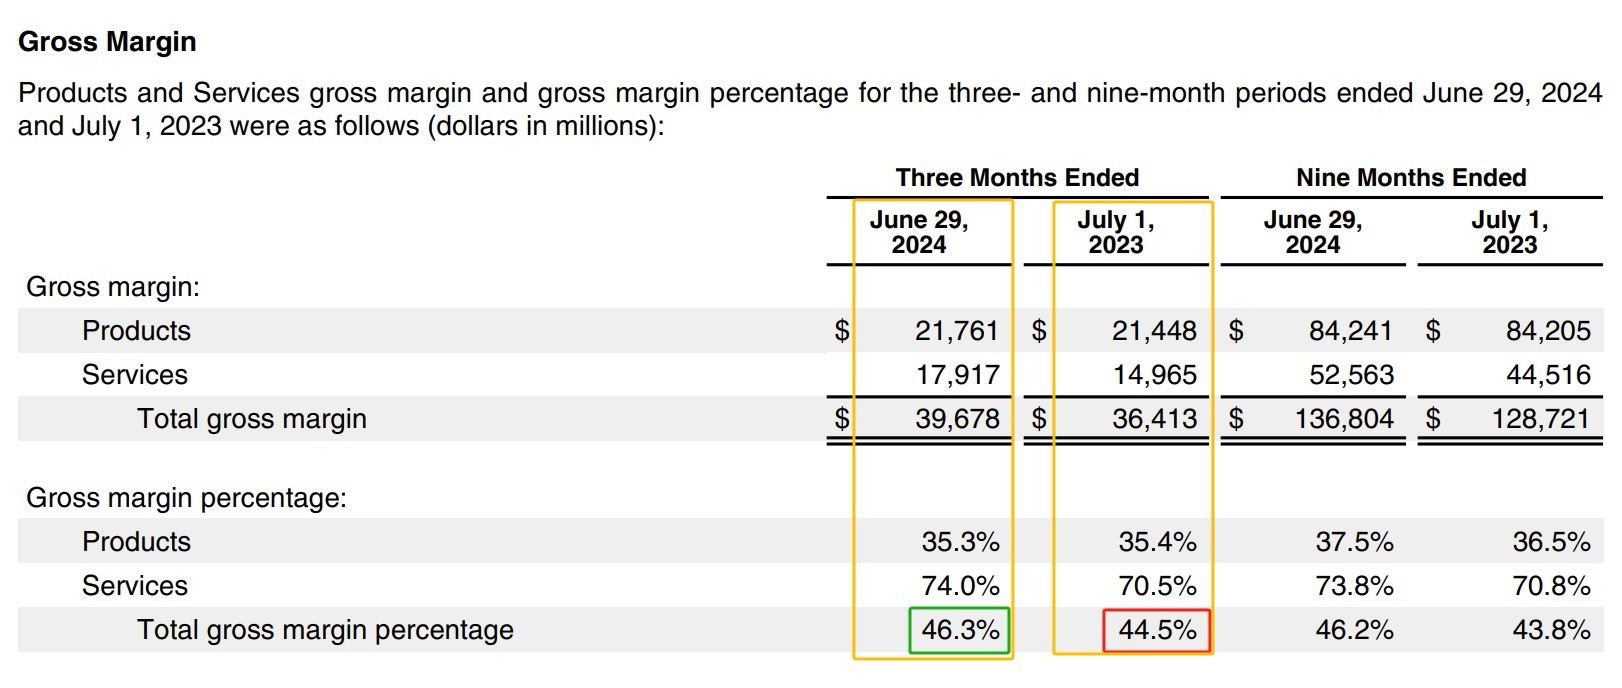
For Apple, the 2024 Q2 gross margin percentage can be calculated as follows:
Gross Margin Percentage = (39,678 / 85,777)×100%≈46.26%
According to their financial statement, this was reported as 46.3%, slightly up from last year's 44.5%, indicating improved efficiency in reducing costs.
3. Operating Expenses
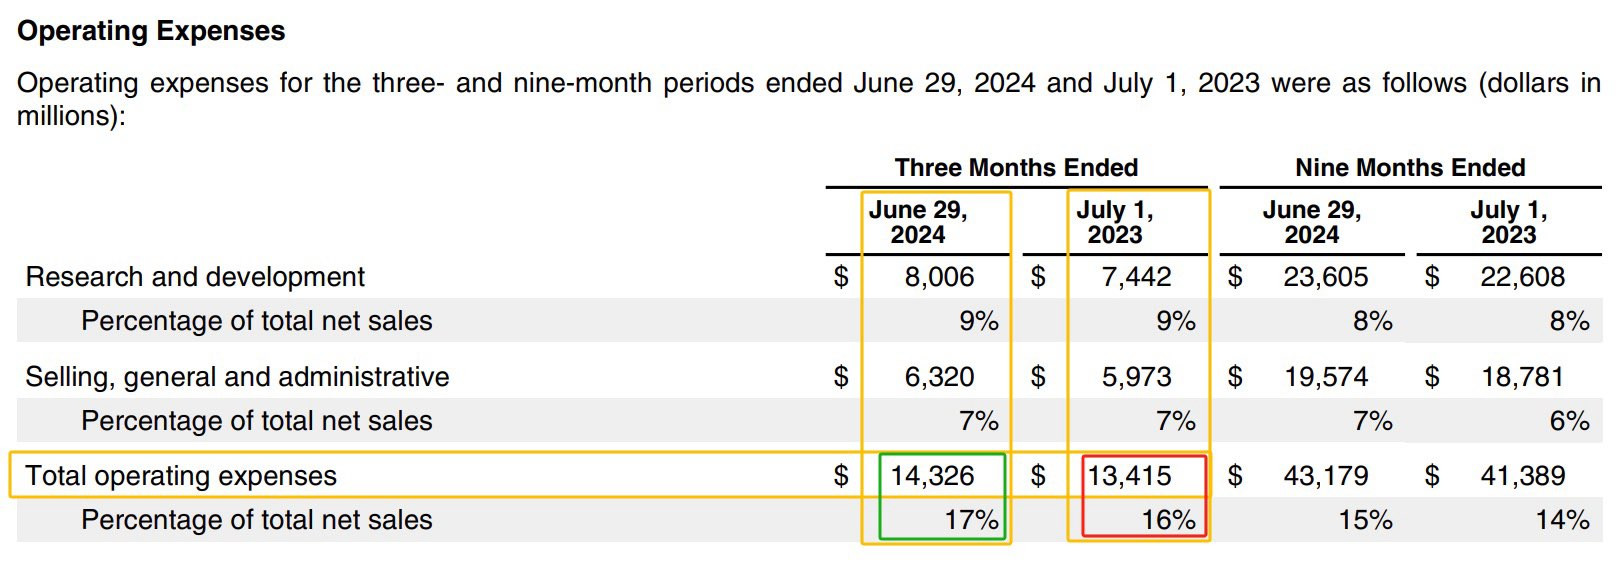
Operating expenses include costs such as salaries for administrative staff, marketing expenses, and office supplies. These are necessary for running the company but aren't directly tied to production. The total operating expenses are added to the cost of sales to give a clearer picture of overall costs:
Total Operating Expenses = Cost of Sales + Operating Expenses
To analyze efficiency, we can calculate the operating ratio:
Operating Ratio = ( Total Operating Expenses / Net Sales ) * 100%
For Apple, the operating ratio in Q2 was 17%, up by 1 percentage point from last year, suggesting increased spending and potential inefficiencies.
4. Operating Income (EBIT)
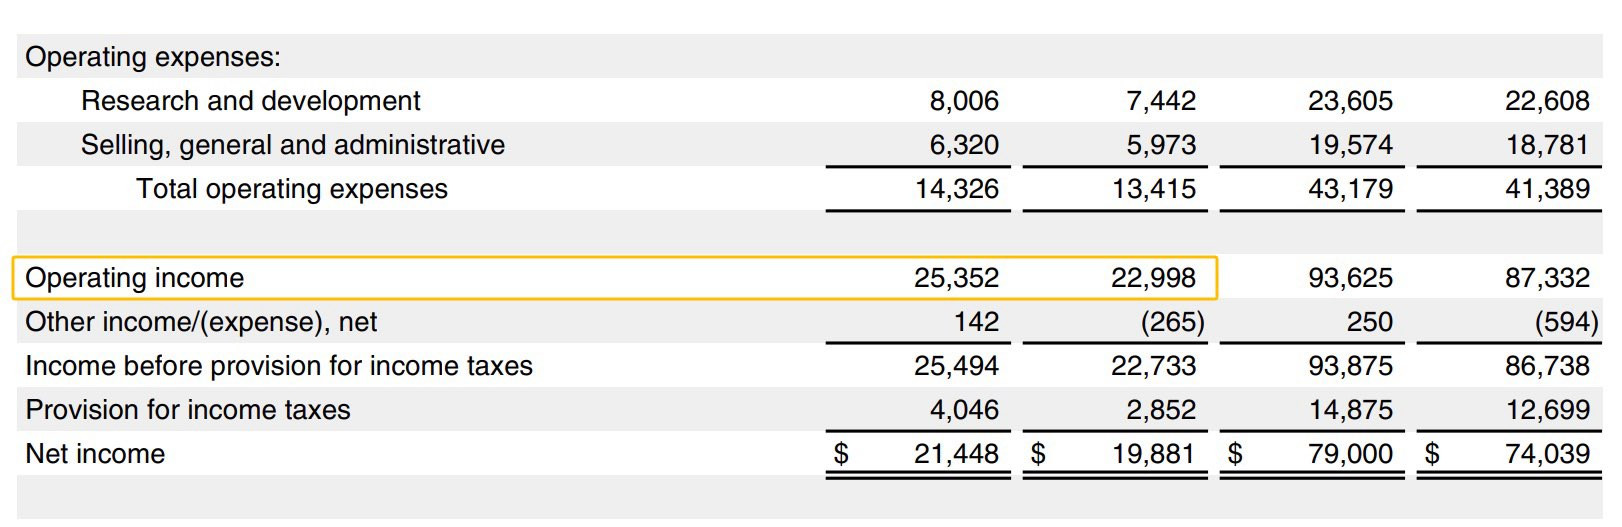
By subtracting operating expenses from gross margin, you arrive at operating income, often referred to as EBIT (earnings before interest and taxes):
Operating Income (EBIT) = Gross Margin - Operating Expenses
A healthy EBIT indicates that a company is generating profit from its core operations. For Apple, the operating income for Q2 was $25,352, up from $22,998 last year, showing improved operational performance.
5. The Miscellaneous Line

You'll also find a line for other income and expenses, which can include various items like investment gains and legal fees. Scrutinizing these footnotes is essential, as ongoing trends (like frequent legal expenses) could negatively impact future earnings. For Apple, the income before provision for income taxes was $25,494.
6. Net Income and EPS
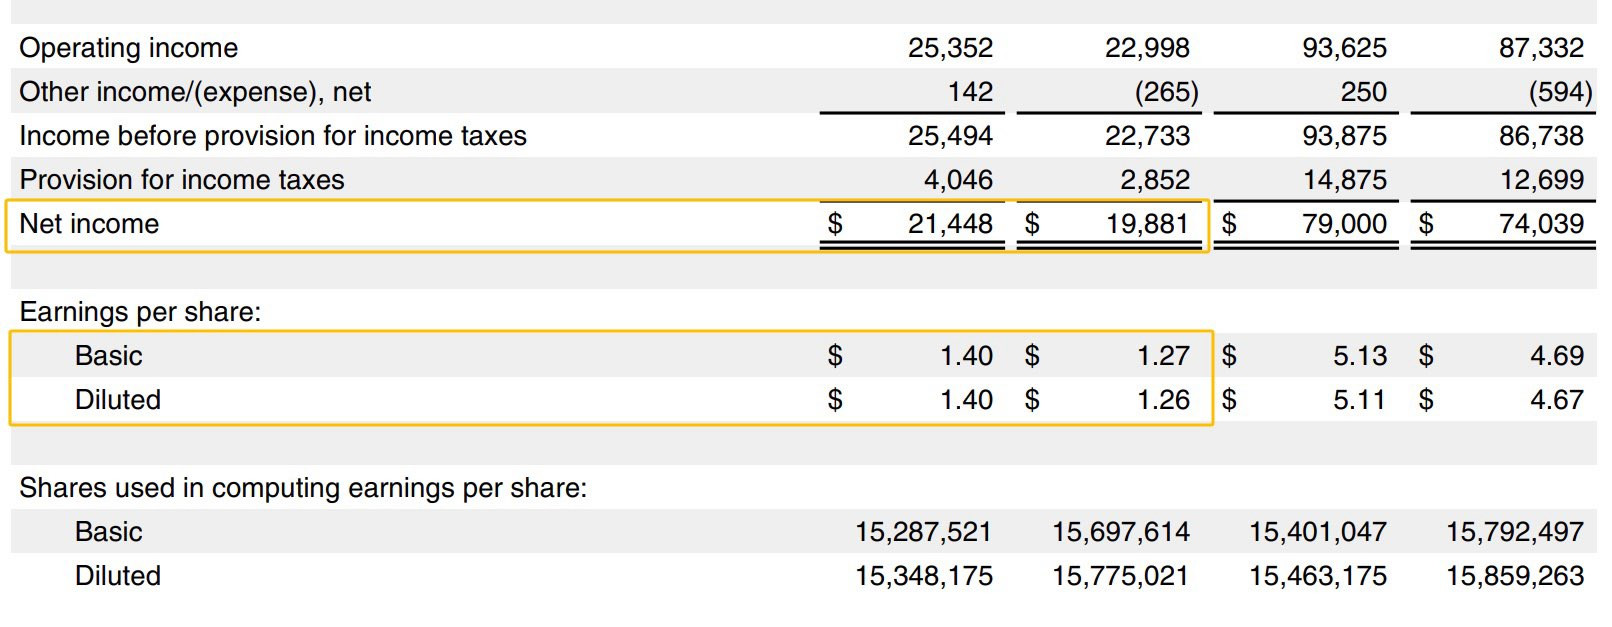
Finally, after accounting for taxes, you arrive at net income—commonly known as earnings:
Net Income = Income Before Provision for Income Taxes - Provision for Income Taxes
To provide context for investors, net income is divided by the number of outstanding shares to yield earnings per share (EPS):
EPS = Net Income / Outstanding Shares
For Apple, the 2024 Q2 net income was $21,448, and the EPS was $1.40, both showing growth compared to the previous year. This indicates improved profitability and makes the company more attractive to investors.
The Devil is in the Details
While the headline numbers grab attention, the nuances in the earnings report can tell a very different story. For instance, a company may report negative earnings but disclose cost-cutting measures or strong sales growth, suggesting potential for recovery. Conversely, positive earnings may be misleading if they stem from one-time gains rather than sustainable growth.
Conclusion
Congratulations! The next time you hear about a corporate earnings report, you'll be able to understand what it means for the company's stock and where those numbers came from.
Now that you know how to analyze an earnings report, what do you find more important when reading one: net income, gross margin, or EPS? Share your thoughts in the comments!