
Ethereum Nears $3,500 as Bitcoin Approaches $100K: Is the Altcoin Season Upon Us?

Ethereum (ETH) has shown a strong recovery since completing wave 2 on November 4, establishing a solid support level near $2,400.
A breakout above descending resistance ignited a sharp rally, pushing the price to $3,450 and marking the conclusion of wave 3.
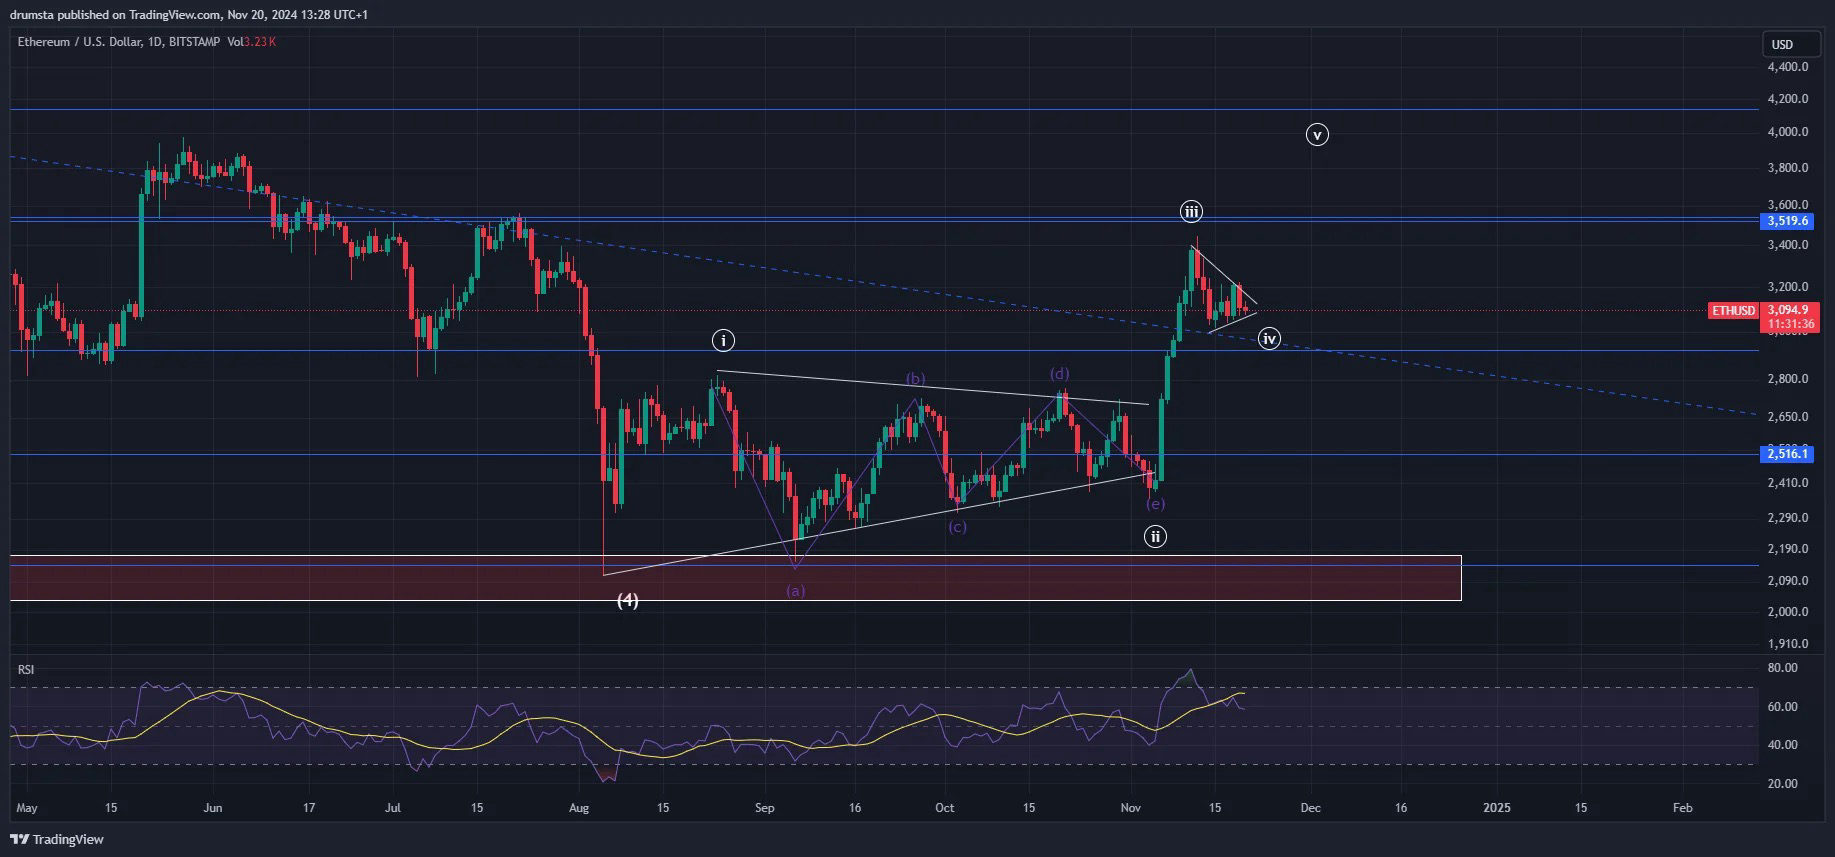
ETH is now consolidating near $3,100 within a symmetrical triangle, potentially representing wave 4 and signaling more upside continuation ahead.
Ethereum Price Analysis
On the daily chart, Ethereum has rebounded sharply after completing wave 2 on November 4, creating a robust support zone near $2,400.
The price broke above a prolonged descending resistance line, confirming a trend reversal and rallying to $3,450, which marked the completion of wave 3 in the current five-wave Elliott structure.
Currently, ETH is consolidating near $3,100 in a symmetrical triangle pattern, potentially signaling the development of wave 4. The RSI shows momentum has cooled from overbought levels, suggesting a brief pause before the next significant move.
Given the price context, the symmetrical triangle can be interpreted as a bull flag.
As the price approaches the triangle’s apex, an upside breakout could push ETH to a new high of around $4,000.
Key Observations
Wave 3 Completion: ETH peaked at $3,450, signaling the end of wave 3 in the current impulsive structure.
Wave 4 Developing: The symmetrical triangle indicates wave 4 is near completion, potentially paving the way for another leg up.
Neutral RSI: RSI shows balanced momentum, providing room for either a breakout or further consolidation.
The conclusion of wave 4 will determine Ethereum’s next trajectory. A breakout above the triangle resistance could mark the start of wave 5, potentially pushing prices to $4,000 or beyond.
On the other hand, a breakdown below $2,900 might indicate a deeper retracement before resuming the uptrend.
Ethereum Price Prediction
On the hourly chart, ETH dropped 13% from its November 12 high of $3,450 to a low of $3,015 on November 15.
A sideways recovery followed, with the price climbing to $3,220 on November 18, forming descending resistance. Despite this, higher lows in retracements created ascending support, forming the current symmetrical triangle pattern.
Two potential scenarios lie ahead, depending on how wave 4 resolves:
A breakout above the triangle would confirm the start of wave 5, potentially driving the price to $4,000 or higher.
A breakdown below triangle support could extend wave 4, with the first target near the 0.5 Fibonacci level at $2,840.
Key Levels to Watch
Immediate Resistance:
$3,140 (0.236 Fibonacci retracement of wave 3).
$3,450 (previous local high near wave 4).
Immediate Support:
$2,969 (0.382 Fibonacci retracement of wave (iii)).
$2,843 (0.5 Fibonacci retracement).
Upside Targets:
$3,700 (shorter wave 5 projection).
$4,000 (psychological resistance and extended Fibonacci level).
Conclusion
Ethereum’s next move will depend on the resolution of the symmetrical triangle. With Bitcoin breaking past $98,000 and edging closer to the historic $100,000 milestone, the stage is set for the long-anticipated altcoin season. If Ethereum’s momentum holds, we could soon see ETH breaking $4,000 and heading “to the moon.” Let’s watch as the market unfolds! 🚀