
Understanding the VIX: A Deep Dive into the "Fear Gauge" and What It Means for Today’s Market

Shearing sheep
April 8, 2025
GoGPT Summarizes Articles
Last week, U.S. stocks experienced a historic plunge after Trump announced massive reciprocal tariffs on American trade partners. Following the details of the tariff proposal on April 2, the S&P 500 dropped 4.84% and 5.97% on Thursday and Friday, respectively. Though Monday’s drop slowed, the index was still down 13.93% year-to-date. The Dow Jones Industrial Average (DJI) and the NASDAQ are respectively down 10.76% YTD and 19.20% YTD.
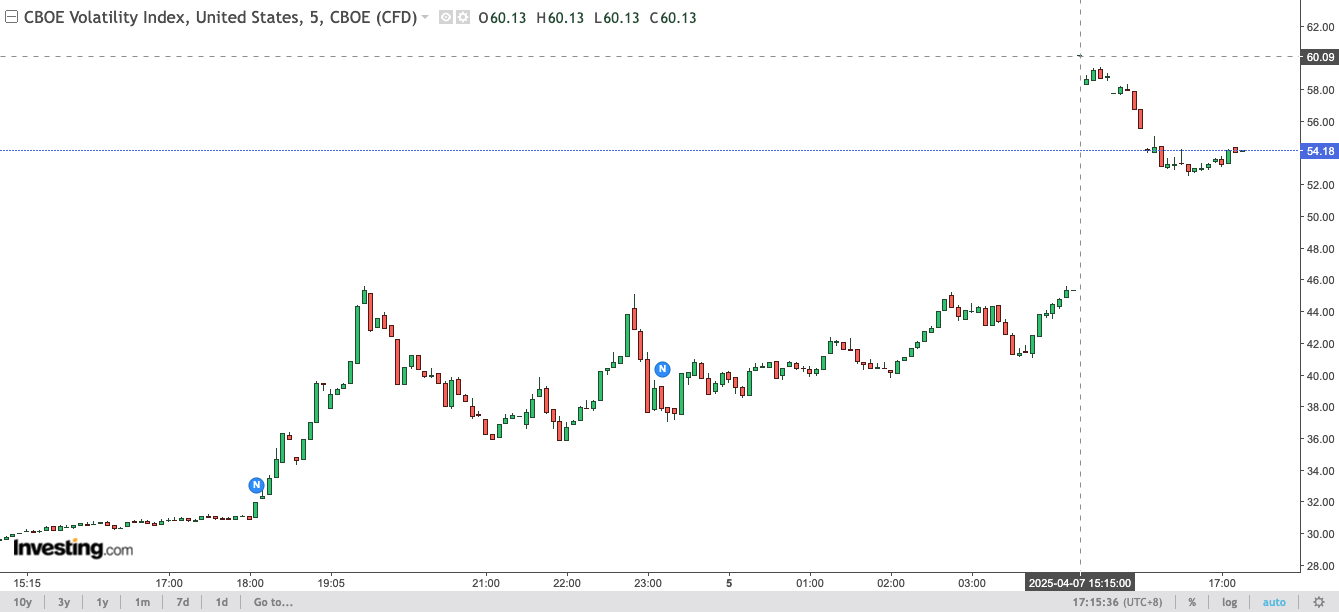
Amid the market collapse, the VIX surged to a high of 60 on April 7, 2025, marking its highest intraday level since August 2023. But what exactly is the VIX, and why does its movement matter? Let’s break down its origins, historical significance, and the forces driving today’s chaos.
What Is the VIX?
The VIX, introduced by the Chicago Board Options Exchange (CBOE) in 1993, measures the market’s expectation of 30-day volatility for the S&P 500. It is derived from the prices of near-term S&P 500 index options, which reflect investor demand for protection against potential downside risks. When fear grips the market, demand for put options (insurance against declines) rises, pushing the VIX higher. Conversely, a calm market lowers the VIX.
Key Characteristics:
-
Inverse Relationship with Stocks: The VIX typically rises when the S&P 500 falls, and vice versa.
-
Mean-Reverting: Historically, the VIX averages around 20. Levels above 30 signal heightened stress, while spikes above 40 often precede market bottoms or crises.
Historical Peaks: When Fear Ruled the Market
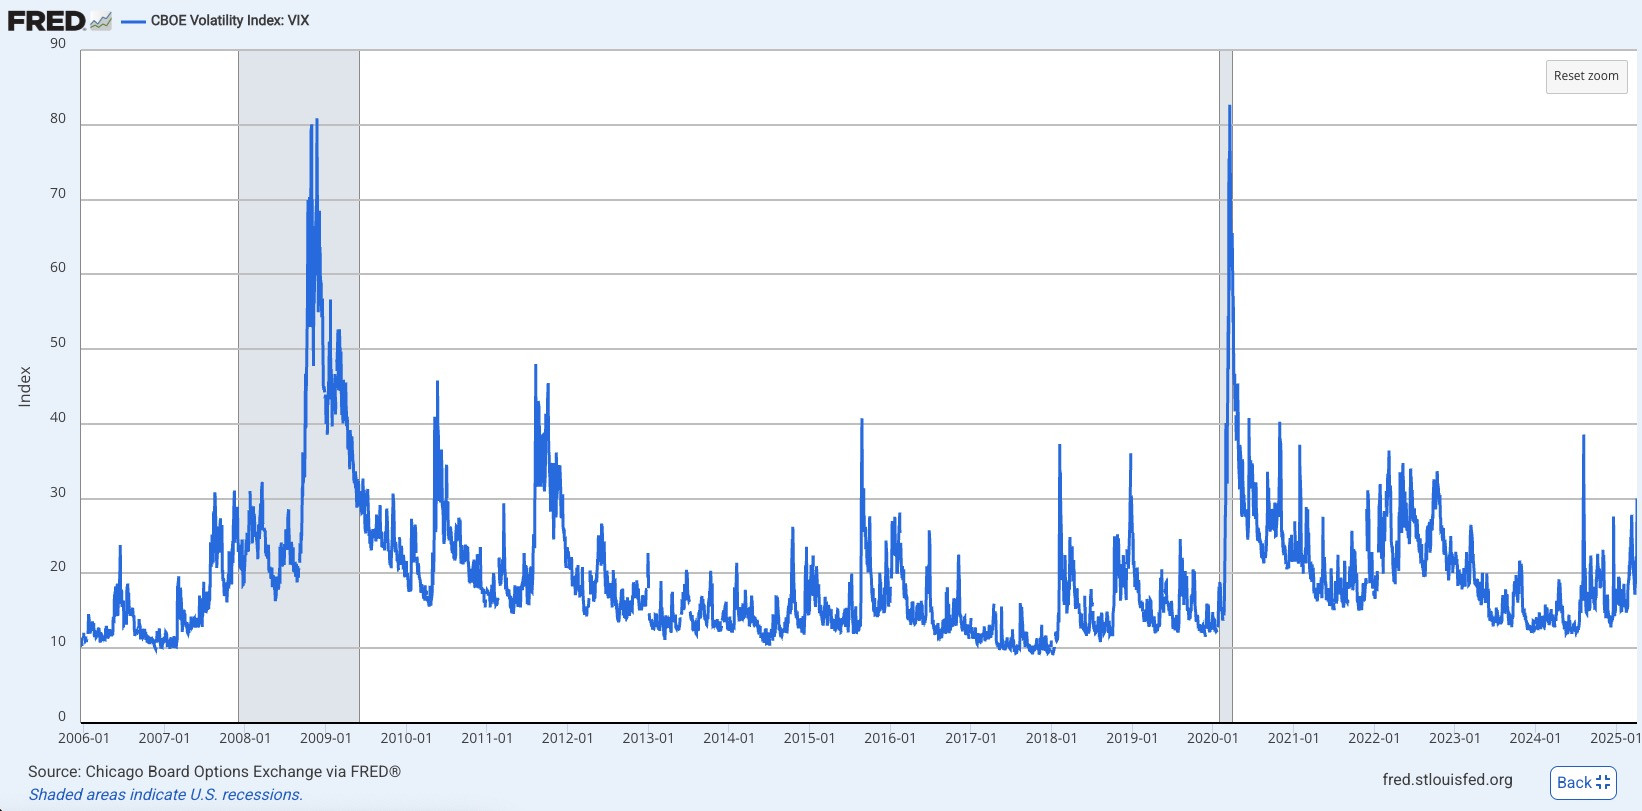
The VIX has been a reliable barometer of market panic during critical financial crises. Here are some notable historical spikes:
1. 2008 Global Financial Crisis
-
Cause: The collapse of the subprime mortgage bubble, triggered by aggressive Fed rate hikes and the bankruptcy of Lehman Brothers, led to a systemic banking crisis. Credit markets froze, and investors rushed to hedge against catastrophic losses.
-
Panic Unfolds: The VIX soared to a then-record 80.86 in November 2008. Stock markets plummeted, with the S&P 500 losing over 50% of its value from peak to trough.
-
Resolution: The U.S. government intervened with massive bailouts (e.g., TARP), quantitative easing, and liquidity injections. By mid-2009, markets stabilized, and the VIX gradually retreated.
2. March 2020 COVID-19 Crash
-
Cause: The rapid global spread of COVID-19 forced lockdowns, halting economic activity. Uncertainty about the pandemic’s duration and impact triggered a historic sell-off.
-
Panic Unfolds: The VIX spiked to an all-time high of 82.69 as the S&P 500 plunged 34% in just 23 trading days. Even “safe” assets like gold initially sold off due to liquidity crunches.
-
Resolution: Central banks unleashed unprecedented stimulus—the Fed slashed rates to zero and launched unlimited QE, while governments rolled out fiscal aid. Markets rebounded sharply by late 2020, with the VIX returning to pre-crisis levels.
3. August 2024 "VIX Nuclear Spike"
-
Cause: A perfect storm of a U.S.-China tariff escalation, Japan’s market crash (triggered by yen carry trade liquidation), and a liquidity crisis in S&P 500 options trading.
-
Panic Unfolds: The VIX briefly hit 65.7 on August 5, 2024—its highest since 2020. The Nikkei 225 plummeted 16%, surpassing its 1987 "Black Monday" drop.
-
Resolution: Emergency Fed liquidity measures and a temporary tariff delay calmed markets. The VIX normalized within weeks, but the event exposed vulnerabilities in algorithmic trading and global interdependence.
These events highlight a pattern: extreme VIX spikes are short-lived but often mark critical turning points.
April 7, 2025: Why the VIX Spiked to 60
The immediate trigger was the U.S. government’s decision to impose reciprocal tariffs—a 10% baseline on all imports, with higher rates targeting China and other trade partners. Set to take effect on April 9, these measures threaten to disrupt global supply chains, reignite inflation, and tip economies into recession. Analysts at JPMorgan estimate a 60% probability of a global downturn, up from 40% last month.
Meanwhile, the Federal Reserve faces a dilemma. While tariffs threaten to boost inflation, markets are pricing in five rate cuts by 2025 to counter slowing growth. Fed Chair Jerome Powell’s recent "wait-and-see" stance has amplified confusion, leaving investors to grapple with stagflation risks (slow growth + high inflation).
Even safe-haven assets like gold and bonds faltered. Gold briefly dipped below $3,000/oz, while U.S. 2-year Treasury yields hit 2022 lows. Bitcoin’s rally to $68,000 suggests some investors view crypto as a new hedge—though this remains speculative.
What’s Next?
-
Short-term: Brace for more volatility. The VIX could stay elevated until the tariff fallout clarifies. Watch the Fed’s March meeting minutes (Thursday) and U.S. CPI data (also Thursday).
-
Long-term: If tariffs stick, expect stagflation—slow growth + high inflation. Sector-wise, defensive plays (utilities, gold) and “security” themes (defense, energy) might outperform.
Final Thoughts
While a VIX of 60 screams panic, history reminds us that fear often creates bargains. As markets digest today’s shocks, disciplined investors may find entry points in oversold sectors—particularly those aligned with long-term trends like AI, renewable energy, and supply chain resilience.
As Mark Spindel of Potomac River Capital noted earlier this week, "The market is holding its breath". Whether this breath leads to a sigh of relief or a gasp for survival depends on how policymakers and investors navigate the weeks ahead. #stockmarket
#stockmarket