Thoughts on the U.S. Q1 GDP Data

The U.S. Commerce Department released new data on April 30 showing that the country's gross domestic product (GDP) contracted at an annualized rate of 0.3% quarter-on-quarter in the first quarter of 2025. In the fourth quarter of 2024, U.S. GDP had grown at an annualized rate of 2.4%.
This marks the first negative GDP growth in the U.S. since the second quarter of 2022.
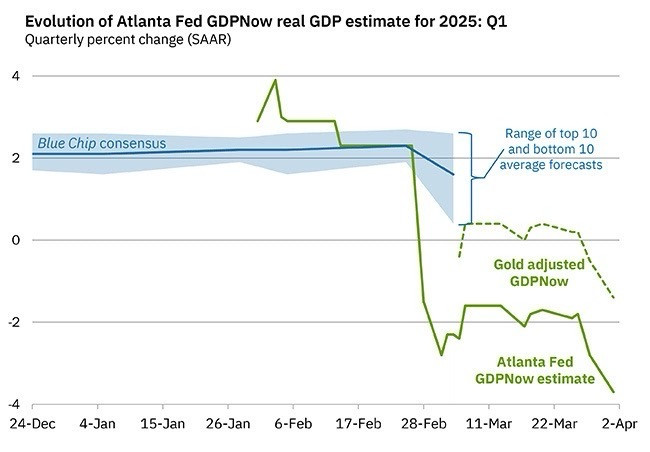
The figure not only fell short of the consensus forecast of +0.3%, but also confirmed signals that leading macroeconomic indicators have been flashing for months: despite the nominal strength of U.S. asset markets, the real economy is slipping into contraction.
This is not an isolated event. Multiple factors form the backdrop:
1. The weakest ADP private payroll data (62,000 jobs added) since July 2024;
2. Cash-equivalent ETFs (SGOV/BIL) saw record weekly inflows exceeding $10 billion;
3. The U.S. M2 money supply remains flat, with liquidity conditions staying fragile post-contraction;
4. Massive fiscal stimulus has failed to spur growth, while U.S. Treasury issuance continues to climb.
Currently, the momentum of private-sector employment expansion is showing a trend of weakening, with narrowing industry breadth. Historical data shows that U.S. nonfarm payroll declines typically precede a surge in unemployment by 1-2 quarters - we are now at the early turning point.
The massive inflows into short-term U.S. Treasuries are not yield-driven but rather for solvency protection. This aligns with market behavior seen before the Global Financial Crisis (2007), the March 2020 crash, and the September 2019 repo crisis. The abnormal rise in liquidity preference during GDP contraction is unlikely to be coincidental and must be treated as a systemic warning sign.
Despite still-loose financial conditions, the U.S. economy recorded negative GDP growth, indicating that private-sector debt capacity has reached its limit and the credit-driven model is failing. The Fed's recent dovish hints may be too late to prevent the snowball effect of credit tightening translating into solvency pressure.
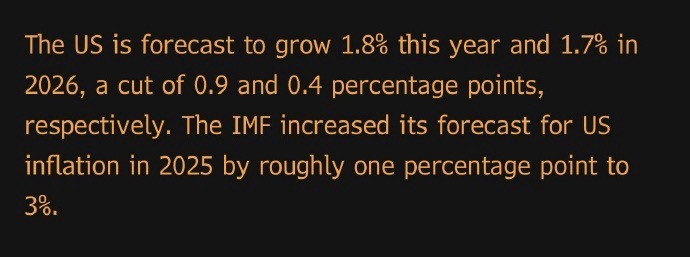
Looking at historical parallels, we can see striking similarities between the current situation and the early stages of U.S. recessions in 2001/2007 - initially dismissed as "technical adjustments" or mild contractions, until the triple negative feedback from labor markets, incomes and credit breaks the surface narrative. By the time the second contraction data is released, U.S. markets are often already deep in a downward spiral. Note: On April 22, the IMF just lowered its 2025 U.S. growth forecast by 0.9 percentage points - the IMF has traditionally been overly optimistic about its host country.
Therefore, the primary focus should now be on the risk of U.S. framework failure.
The Fed could certainly take aggressive action (surprise rate cuts/liquidity injections) to briefly stimulate a risk asset rebound. However, if Trump persists with damaging tariff wars, the structural foundation of the U.S. economy - sustained damage to private-sector labor income and consumption capacity - means any short-term reflation might only accelerate capital flight into gold, cash or strategic assets.
Note: This quarterly GDP contraction marks the first structural reversal in U.S. real economic output under the triple pressures of ongoing monetary tightening, rising debt servicing costs and exhausted fiscal stimulus. Market participants who optimistically view this as a "mild adjustment" or "soft landing" may be misjudging the critical inflection point as the U.S. economic cycle shifts into contraction.
Simply put: Current market pricing has not fully reflected this paradigm shift, leaving a precious window for the clear-eyed to position. By the time Q2 negative growth data confirms recession, the hedging window may already be closed.