Negative Signals in the April Employment Report

There are many abstract negative signals in the U.S. April employment report, such as:
1. Weak Real Wage Growth
Wages grew by 3.8% year-over-year, but with stubbornly high inflation in necessities like insurance, rent, and services, this wage growth barely maintains real purchasing power. In many categories, real purchasing power remains insufficient.
2. Stagnant Average Weekly Hours
Table B-2 shows average weekly hours holding at 34.4 hours, with reduced overtime in manufacturing. This signals stagnant labor demand.
- Don’t mistake "fewer hours" for "less work"—hours are the first adjustment before layoffs.
- Declining hours often mean full-time jobs turning into part-time, making this a leading indicator of economic softening.
3. High Part-Time Employment for Economic Reasons
Per Table A-8, 4.7 million Americans work part-time due to economic reasons (e.g., reduced hours or inability to find full-time jobs).
- These workers are counted as "employed," but the quality of employment is poor.
4. Rising Permanent Job Losses
Table A-11 shows permanent unemployment increasing from 1.8 million to 1.9 million, with long-term unemployed now comprising 23.5% of total unemployment.
- This is structural labor market erosion, not cyclical churn.
- Another 5.7 million want a job but aren’t counted as unemployed (didn’t actively search in the past 4 weeks).
5. U-6 Underemployment Rate Climbs
The broader U-6 rate (including discouraged workers and involuntary part-timers) rose significantly from 7.4% to 7.6%.
- A truly strong labor market would see U-6 declining, not rising.
6. Imbalanced Sectoral Job Growth
- Healthcare (+51K jobs) and financial activities (+14K) grew, while:
- Manufacturing lost 1,000 jobs.
- Federal employment dropped by 9,000.
- Public-sector contraction + private-sector slowdown = red flag.
The Statistical Mirage
To manufacture a "win," the U.S. statistical agencies applied the most aggressive "birth/death model" adjustment in years—adding 393,000 phantom jobs based on the assumption that "new businesses must hire workers."
- This artificially inflates the headline number while real indicators (rising long-term unemployment, underemployment, stagnant hours, soaring U-6) tell a far gloomier story.
Downward Revisions Confirm Weakness
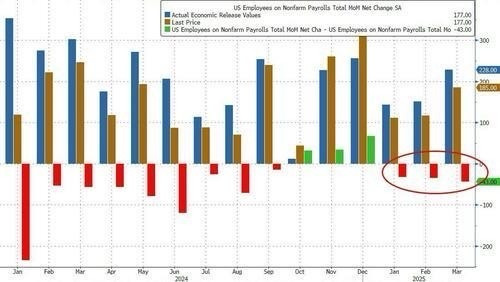
- March jobs revised down sharply: 228K → 185K (third consecutive downward revision).
- February jobs also revised down: +117K → +102K.
- Combined, Feb-Mar jobs were 58K lower than initially reported.
The "strong" headline masks deteriorating labor quality and statistical manipulation. When the birth/death model’s boost fades, expect a hard reality check.