
Can the S&P 500 index reach 6,000 points in June?

The S&P 500 index in the US stock market saw a significant increase of 6.2% in May, reaching its largest May increase since 1990 and its strongest monthly increase since November 2023. This rally was mainly fueled by the relief of tariffs by Trump.
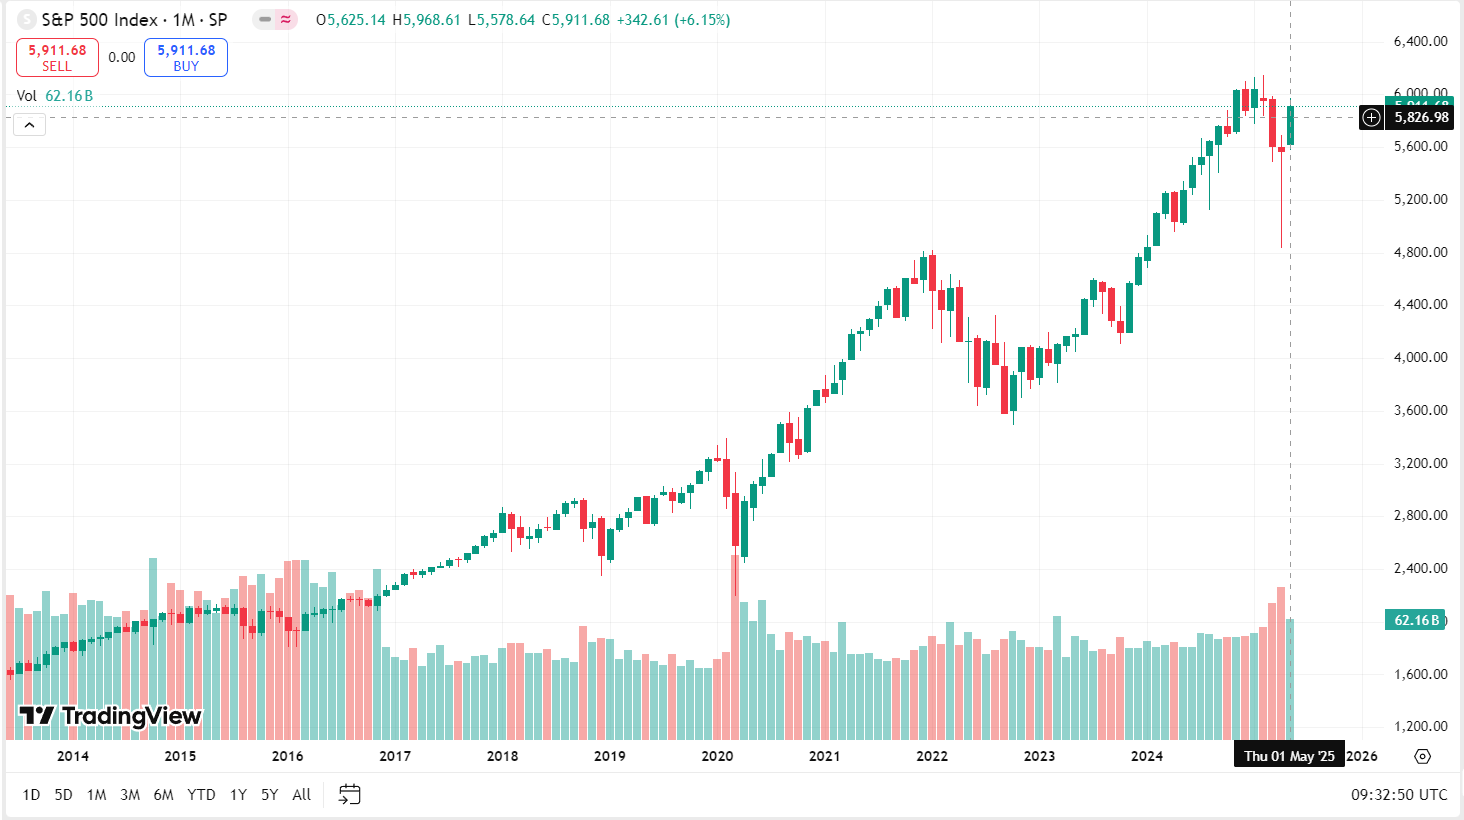
However, data shows that over the past 30 years, the average increase of the S&P 500 index in June has been only 0.2%, faring much worse than the average increase of 0.8% in the other 11 months.
So, will this upward trend continue into June? Can the S&P 500 index break through the 6,000-point mark? Let's briefly discuss this today.
The Retail Revolution in May
First, let's review the just-passed May.
The US stock market in May presented a typical feature of "index carnival and stock divergence".
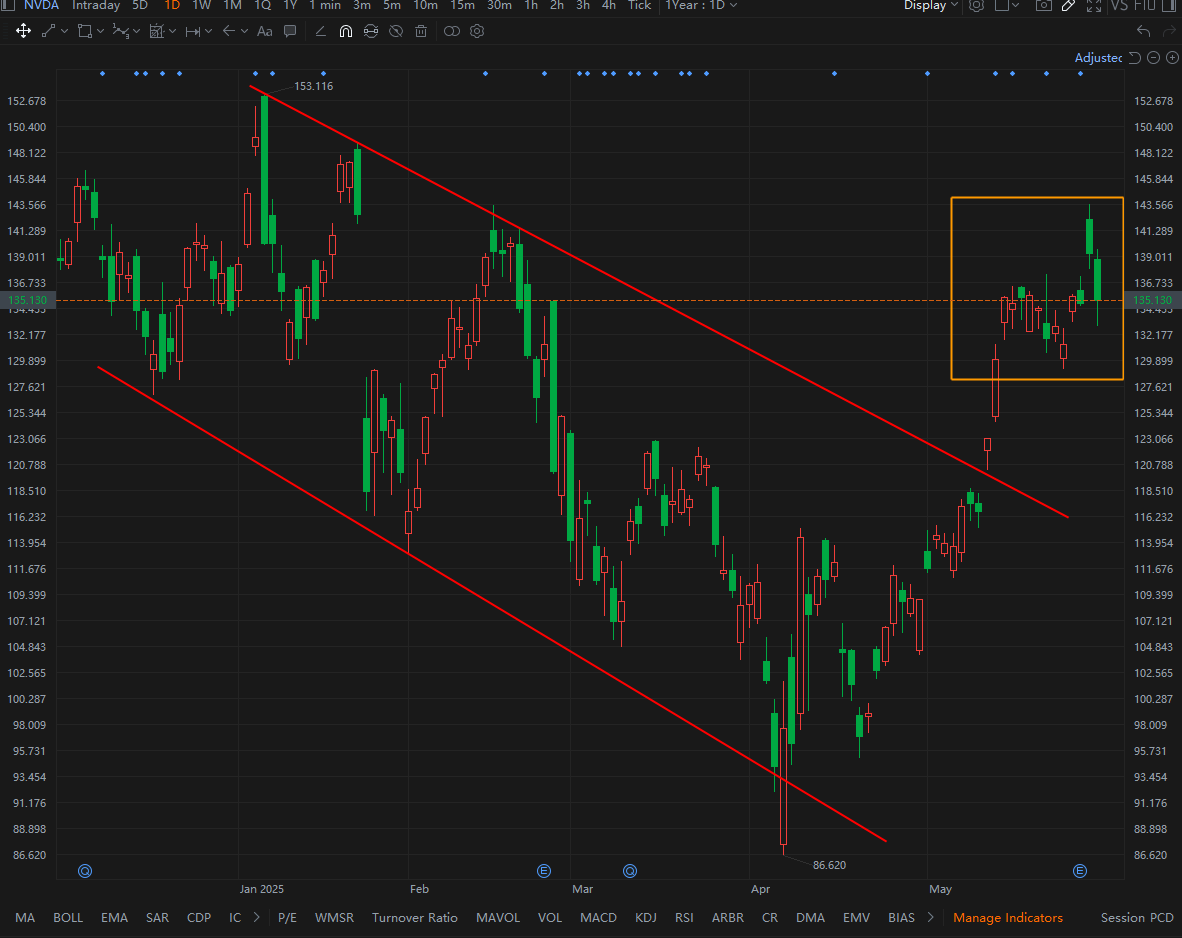
The S&P 500 index closed at 5,911.69 points, just a step away from its all-time high; the Nasdaq index witnessed its strongest performance in May since 1997. The explosive growth in the demand for AI computing power has become the core driving force for the soaring stock prices of technology giants. Nvidia's monthly increase reached 19%, and Apple's market capitalization once exceeded the $3-trillion mark.
It is worth noting that the continuous entry of retail investors has become an important support for the market. Data shows that they have made net purchases of US stocks for 22 consecutive weeks, with their trading volume accounting for 19.5%, recreating the popularity of the "retail revolution" in 2021.
However, the vulnerability of the market became apparent at the end of the month. Trump administration's remarks on tariff policies triggered concerns among investors, and the three major indexes experienced a slight pullback, highlighting the market's high sensitivity to policy risks.
From the perspective of valuation, the price-earnings ratio of the S&P 500 index has reached 28.37 times, at the 93.75% percentile in the past 20 years. The Shiller price-earnings ratio is even approaching the level during the Internet bubble in 2000.
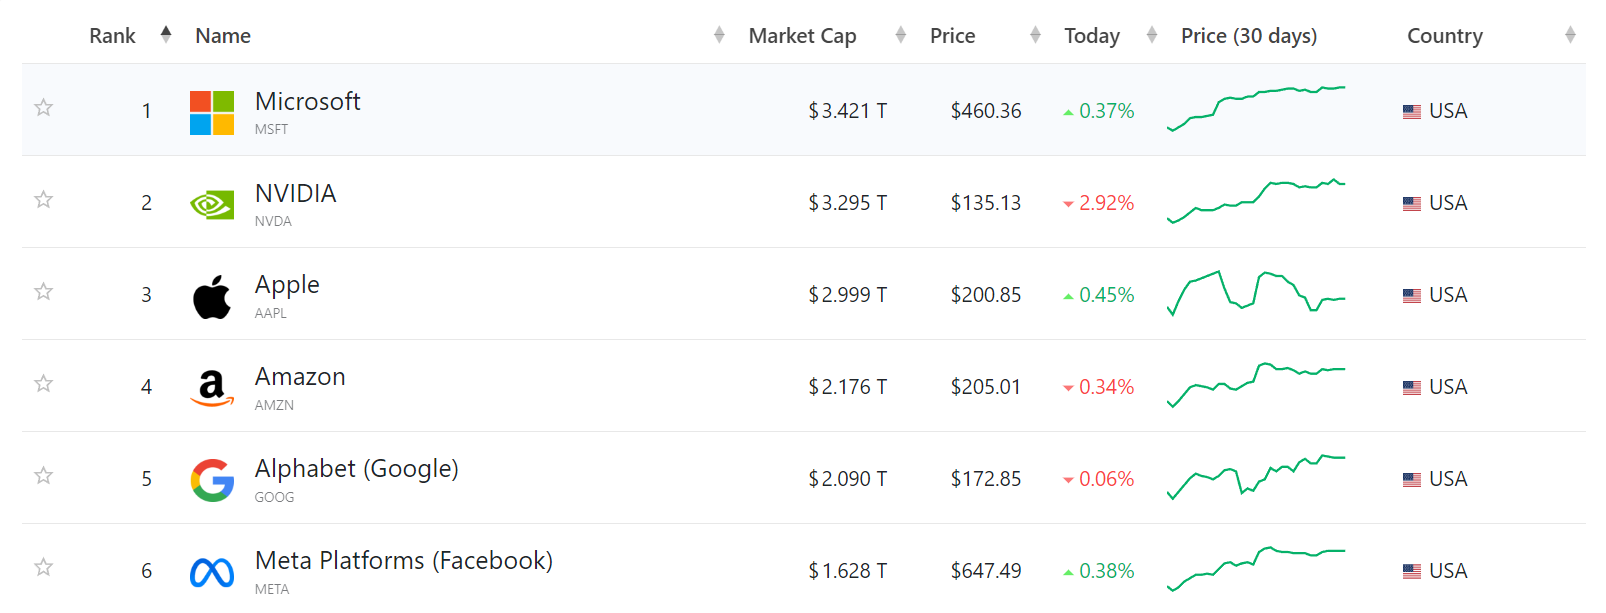
The current expansion of market valuation is mainly dominated by the "Magnificent Seven" companies such as Apple and Microsoft. The market capitalization of these seven companies accounts for 33% of the S&P 500, which inevitably reminds people of the herd-ing risk at the end of the "Nifty Fifty" market in the 1970s.
The US Stocks Face Multiple Hurdles in June
Looking ahead, the first major test that the US stocks will encounter in June will be the interest rate decision to be announced on June 18.
Two days later, the "triple witching day" will arrive.At that time, a large number of stock options will expire, which will intensify market volatility.
And at the end of June, the quarterly portfolio rebalancing of funds will be due.
These are all important challenges that the US stocks must face in the coming month. Whether they can overcome these obstacles is crucial to whether the bullish momentum will continue and push the S&P 500 index to the important psychological threshold of 6,000 points.
As I mentioned earlier, according to historical experience, June do not seem to be conducive to the continued strength of the US stocks. Over the past 70 years, in the years following the US presidential elections, the S&P 500 index usually has a lackluster performance in early June, because investors tend to take profits before the summer vacation season arrives, especially when the stock prices rise sharply in May, like this year.
Furthermore, in recent weeks, fund managers have reduced their cash positions and bought a large number of US stocks, with the bullish momentum being strong. This makes people wonder who will take over and continue to buy?
In addition, some analysts have warned that Trump's policies are unpredictable. If he imposes tariffs on imported semiconductors and drugs, then the recent gains in the US stocks may be wiped out.
Some Takes
The S&P 500 index has been fluctuating horizontally in the high-level range of 5,786-5,968 for 14 days. Even super-giants such as Nvidia and Tesla, which seem to have been rising all the time, have returned to the level of two weeks ago after the plunge on Friday.
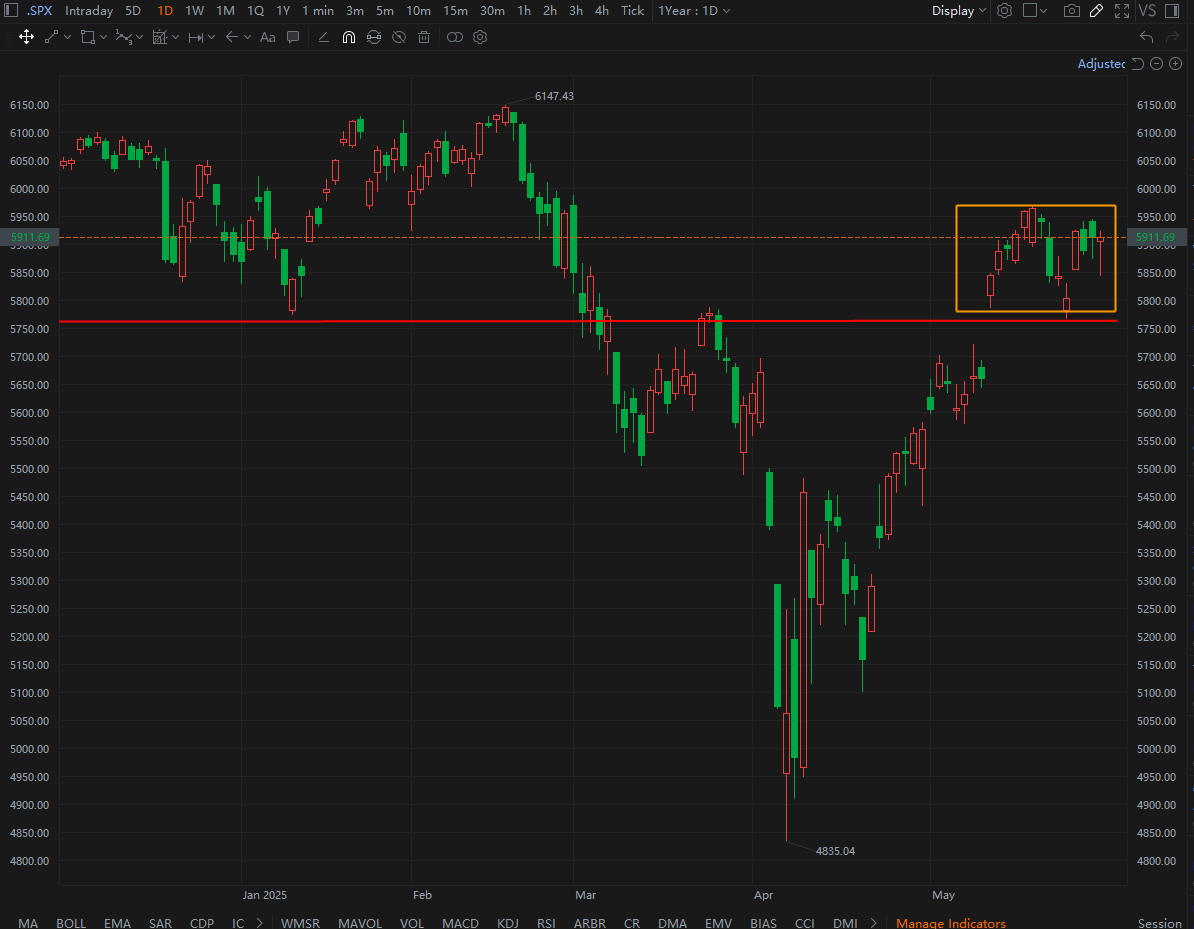
The reason why many people think that the bull market in the US stocks has returned is largely because they are too short-term. If you look at a longer-term period, you will actually find that there is still a very obvious fluctuating range in the market.
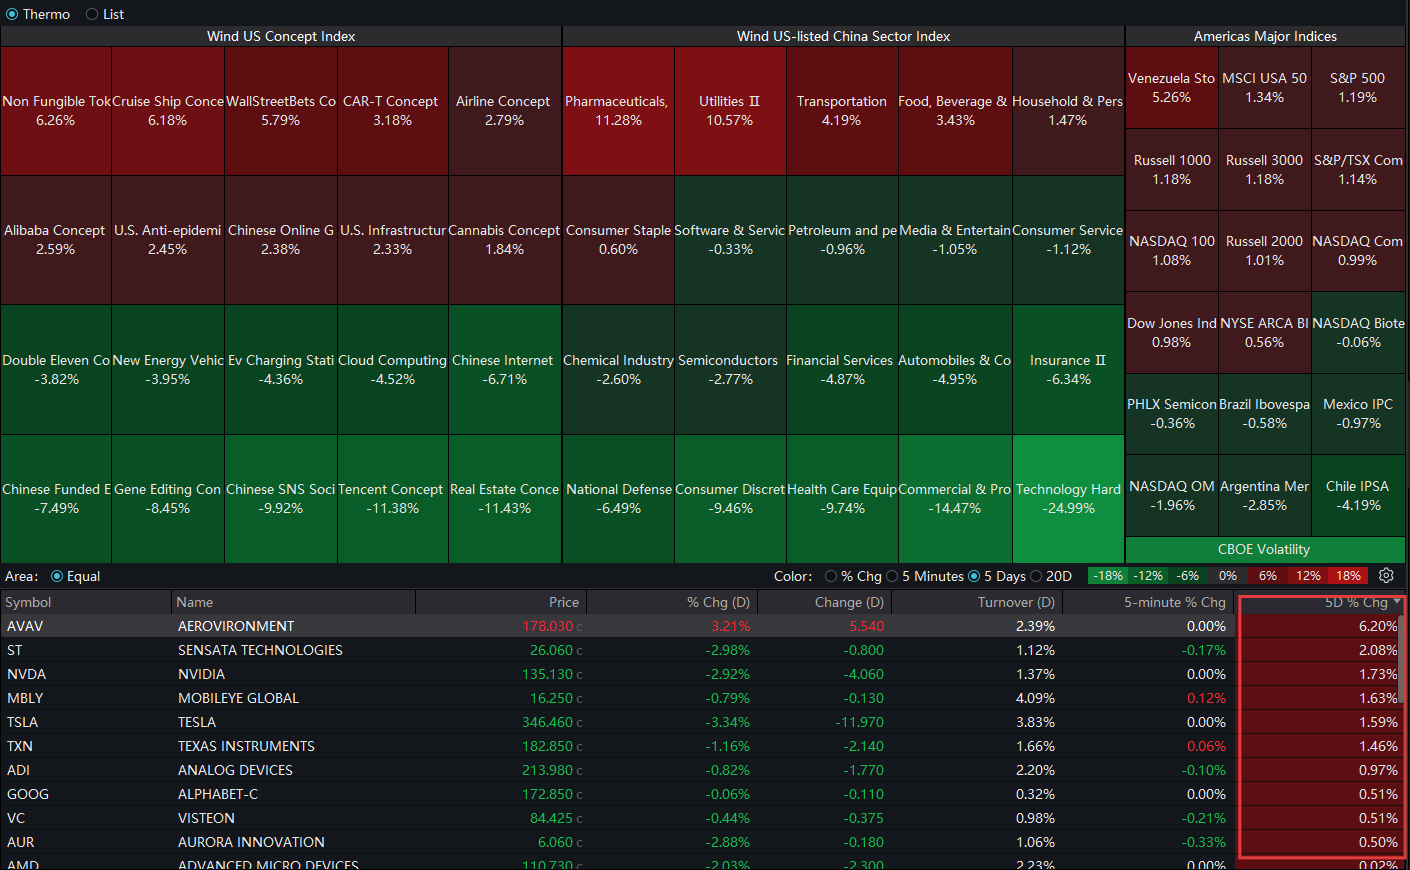
This round of rebound in the US stocks has soared by 22% from the bottom, and many companies have even soared by more than 50%. If you have caught this wave of rebound, even if you have only gained half of it, you will actually have a return of nearly 30%. However, at this position, the desire of institutions to take profits and stop losses is very strong.
The index is fluctuating horizontally at this position. Personally, I think it is more likely to go down. However, the trend of the macro-market is often unpredictable because there are so many sudden situations. But if it breaks through upward at this position, I will not think that my prediction is wrong, because in terms of trading, I am operating according to the fluctuating market without a clear direction.
At this stage of the US stock market, it is advisable to hold 20%-30% of the positions. Do not be too aggressive. The focus should still be on technology giants and some star stocks.