
What's the S&P 500 Really Thinking? This Chart Spills the Tea!

From the technical perspective of volume profile methodology, let's analyze the future market correction (if any). I divide the market evolution from March this year to now into phases a to f, and the volumetric structure corresponding to each phase is an interpretation of the market trend.
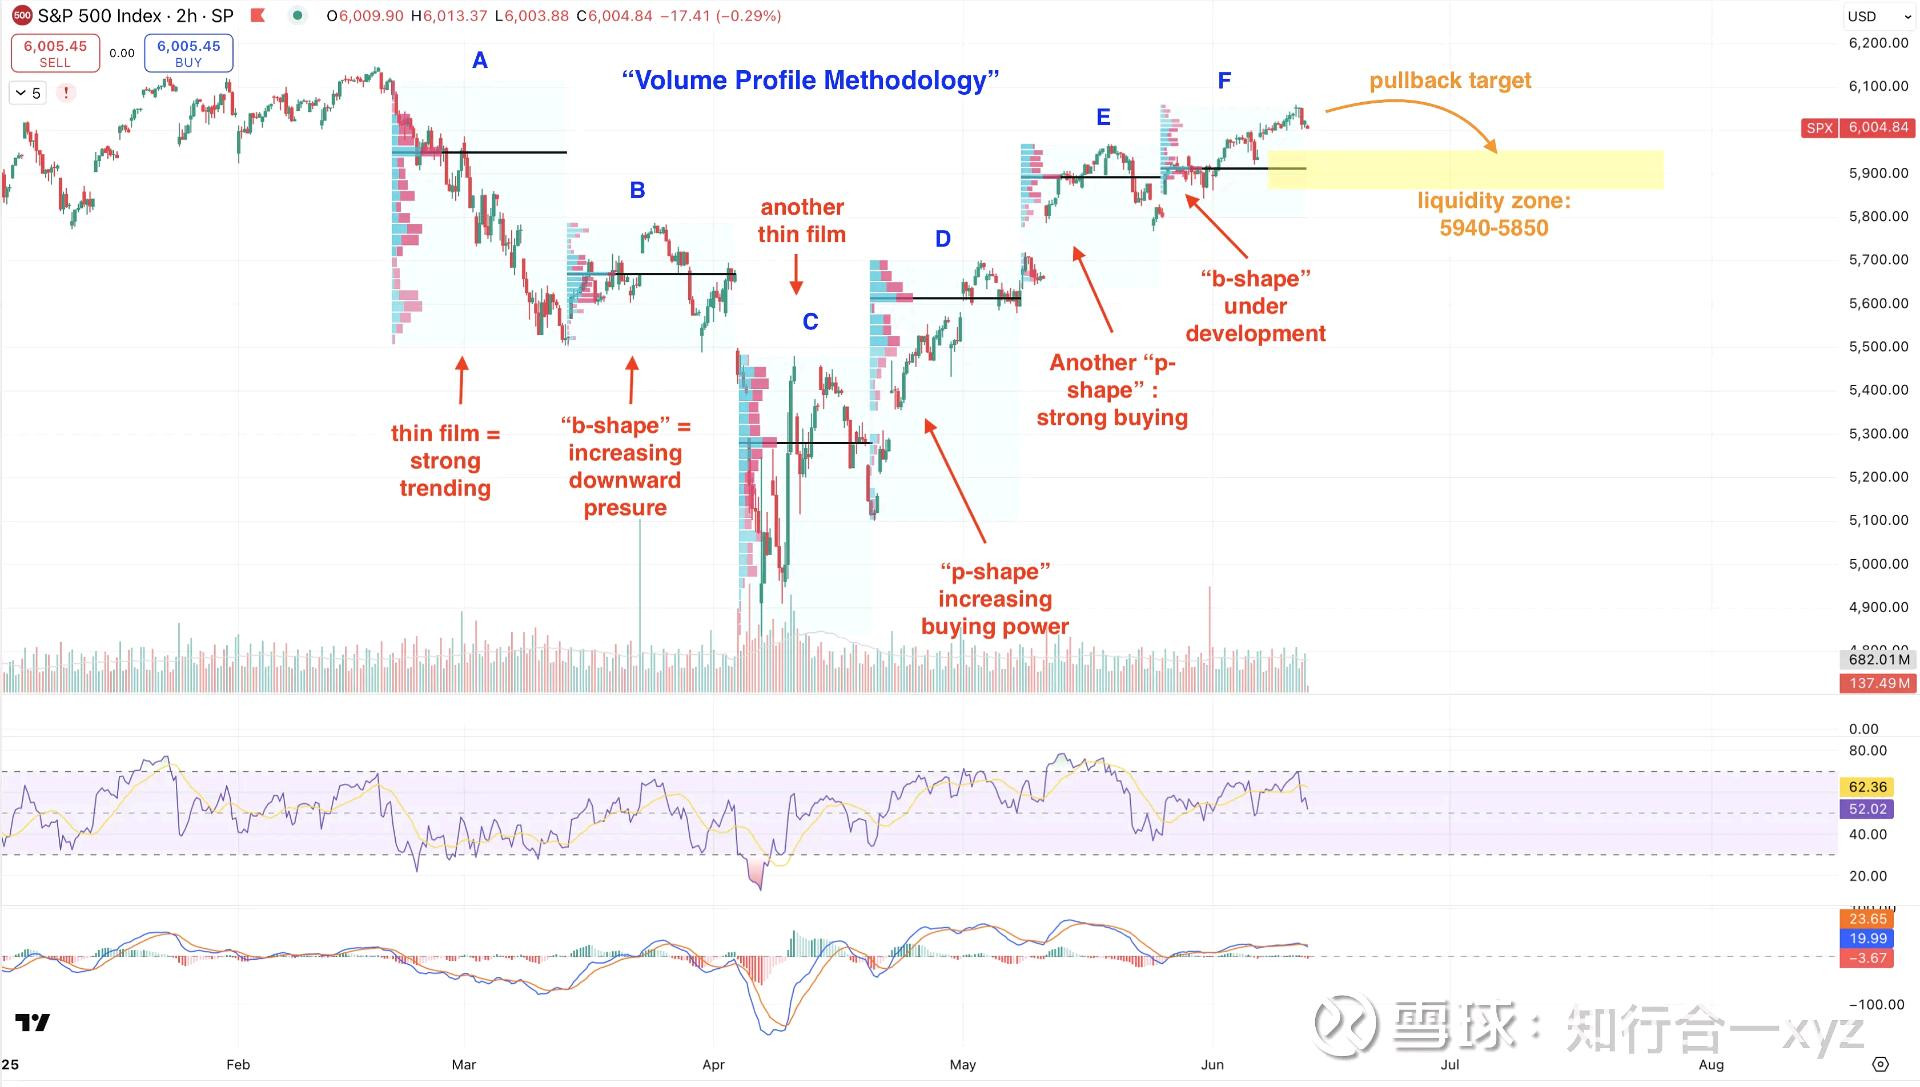
Phase a: The volume profile shows a "thin structure", which usually represents a strong trending market. The meaning behind it is that all players (smart money or not) cannot reserve order blocks in advance (no pending order/no preparation). On the contrary, this is an aggressive trading behavior, which can be understood as "suddenly everyone gets on the bus/jumps off the bus", and such a phenomenon is usually triggered by unexpected macro.
Starting from March, the frequency of various tariffs increased, which triggered the catalyst in this way, and the market priced in in advance.
Phase b: The volume profile shows a "b shape", which usually means selling pressure dominance and the upcoming downward pressure. This is reflected in the market's attitude towards an uncertain environment. The low-volume POC indicates that the transaction is concentrated on the bottom side. And the final failure to breakout of the POC indicates that the previous price in level was not in place, and then the stage of selling power was completely completed.
Phase c: Another "thin structure", superimposed with various panic-intensified stampede selling. Until smart money took action, a large number of bargain hunting was bought around April 7.
Phase d: The volume profile begins to show a "p shape", which means that emotions swing between extremes. After most of the negative emotions are purged, the tariff is relaxed. The p shape represents buying pressure dominance. It can also be understood as the corrective behavior after realizing the fake crash/overreaction, and the purchase is recovered.
Phase e: The "p shape" pattern continues, and the corrective behavior triggers a small range of fomo. The macro is relaxed, and the market sentiment pendulum returns to the midpoint and continues to be dominated by the uptrend.
Phase f: It is also the structure that is currently being formed. We can observe that the current point of control is around 5950 points. At present, there is a probability of forming a "b shape" representing downward pressure, but confirmation is required, that is, a significant downward close/price action around 5950 points.
Therefore, fundamental catalysts such as macro are still needed to determine the true structure of phase f. It can only be said that there is a certain probability of downward. If it happens, it will just form the pullback previously judged, that is, completely complete the inverse head and shoulder and the behavior of the last point of support in the accumulation phase.
If a pullback occurs, the first path may be to drop to around 5940-5850, which is the support formed by the previous poc in the volume profile.