
Technical Analysis: The U.S. stock market still has strong support at the current stage

I took some time over the weekend to talk about U.S. stocks and judge where they might go next.
First, let's look at several market events:
- The conflict between Iran and Israel.
- Corporate buybacks have basically stopped.
- JPMorgan predicts that crude oil will rise to $120 per barrel.
Regarding the first point, I won't elaborate much—it seems this issue won't end anytime soon. If the situation escalates later, the market may plummet; if it subsides, the impact will end early.
Second, the rise in crude oil prices will drive up U.S. inflation, reducing the likelihood of interest rate cuts. This is something we need to pay attention to.
There is an old Wall Street saying: "Sell in May and go away."
This year, it seems to have lost its validity. Although the Trump administration's tariffs sparked a sharp market decline in April, U.S. stocks rebounded rapidly in May, surprising many investors. Technically, a series of positive signals indicate that this rally is expected to continue throughout the summer.
The Advance-Decline Line of the S&P 500, a broad indicator measuring the ratio of advancing to declining stocks, rebounded to an all-time high in May after briefly dropping to its lowest level since January in April.
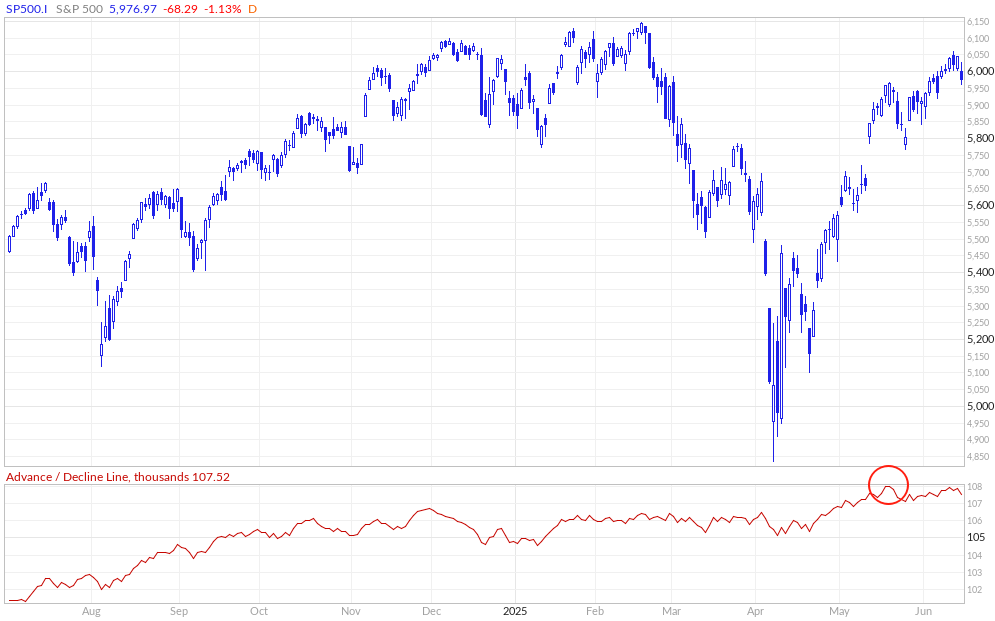
This is one of the most persuasive technical signals, indicating that the current rally is more likely a healthy bull market rather than a short-lived rebound.
Another rare but closely watched technical indicator, the Zweig Breadth Thrust (ZBT), also emerged at the end of April, further confirming the sustainability of the market rebound. ZBT is a strong bullish signal, and its occurrence typically signals that the market has recovered from a deep correction.
Market breadth has continued to improve since then. At the end of May, 10 out of 11 S&P 500 sectors rose, and the technology sector almost fully recovered its year-to-date losses.
In July last year, the market plunged due to poor data, followed by a pause. Then, a black swan event of Japan's interest rate hike caused an oversold situation, after which it rebounded but failed to reach the previous high, leading to a technical correction. However, the correction didn't hit the previous low, forming a W-bottom before starting a slow bull trend.
Looking at this year's trend: initially, Trump's hawkish tariff stance sparked a sharp decline, followed by a pause. After the tariff announcement, another black swan caused overselling, and then a rebound occurred. Currently, it hasn't reached the previous high, and a Middle East black swan has triggered a correction.
In fact, the market's reaction to war shouldn't be overly significant—after all, the Russia-Ukraine conflict was no less intense. The market just needs a narrative; whether it rises or falls, there must be a reason. Now, it's simply finding an excuse to decline.
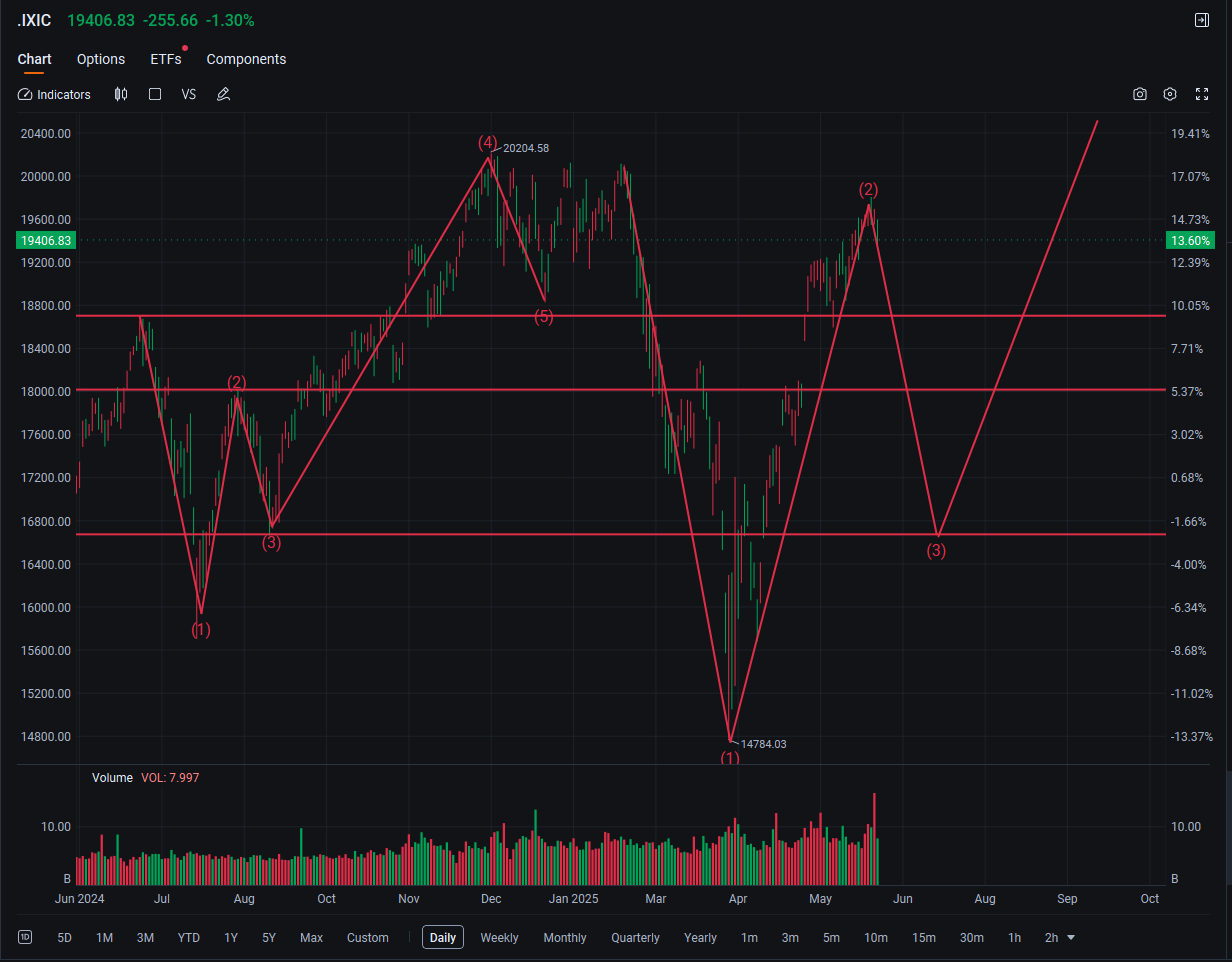
This chart shows the Nasdaq; of course, the S&P 500 can also be used as a reference—it works either way.
I have marked three support lines and several trend lines: around 18,600, 18,000, and 16,500. The lower these lines are, the stronger the support. If history repeats and the market reaches 16,500, it would be a prime time for aggressive buying.
In terms of capital flows, the improvement in market technicals has attracted the return of "leveraged investors" who had previously reduced their positions. Quantitative funds and systematic capital have also re-entered the market, providing capital support to drive stock prices higher or act as a buffer during corrections.
Although U.S. household investors have cooled off, they haven't turned into net sellers, meaning market fundamentals remain relatively stable without large-scale panic selling. This helps the market maintain a certain price level and form support.
For now, timing purchases to add positions seems to be a reasonable strategy.