
TMT Valuations Back to Dot-Com Bubble Levels, Can Tech Hold the Line?

Shearing sheep
August 8, 2025
GoGPT Summarizes Articles
The U.S. tech, media, and telecom (TMT) sector is back in the spotlight — and not just because of AI hype or quarterly earnings beats. The latest Bloomberg data (as of Aug 7) shows valuations have climbed to levels not seen since the dot-com bubble era, raising a key question: how long can this rally defy gravity?
The Valuation Picture
TMT’s forward P/E now stands at 26.7x, the highest since 2009 and far above its 2015–2019 average of 16.9x. That’s an 8.7 standard deviation jump from the pre-pandemic norm — extreme by any measure.
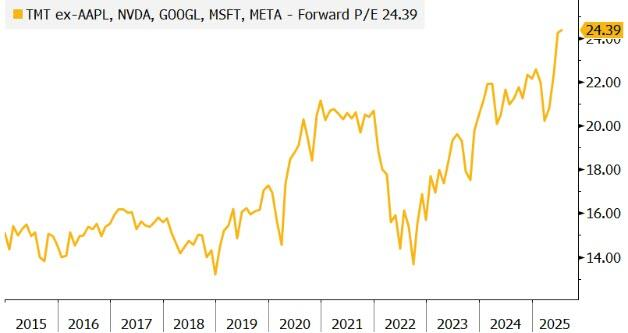
Strip out the “Magnificent Seven” — Apple ($AAPL), Microsoft ($MSFT), Alphabet ($GOOGL), Amazon ($AMZN), Meta ($META), Nvidia ($NVDA), and Tesla ($TSLA) — and the picture looks even starker. The rest of the TMT sector is trading at 24.4x forward earnings, an 11.7 standard deviation premium over its historical average. By contrast, the S&P 500 equal-weight index is at just 17.9x, showing how much large-cap tech is inflating the market’s overall multiple.
Market Concentration Risk
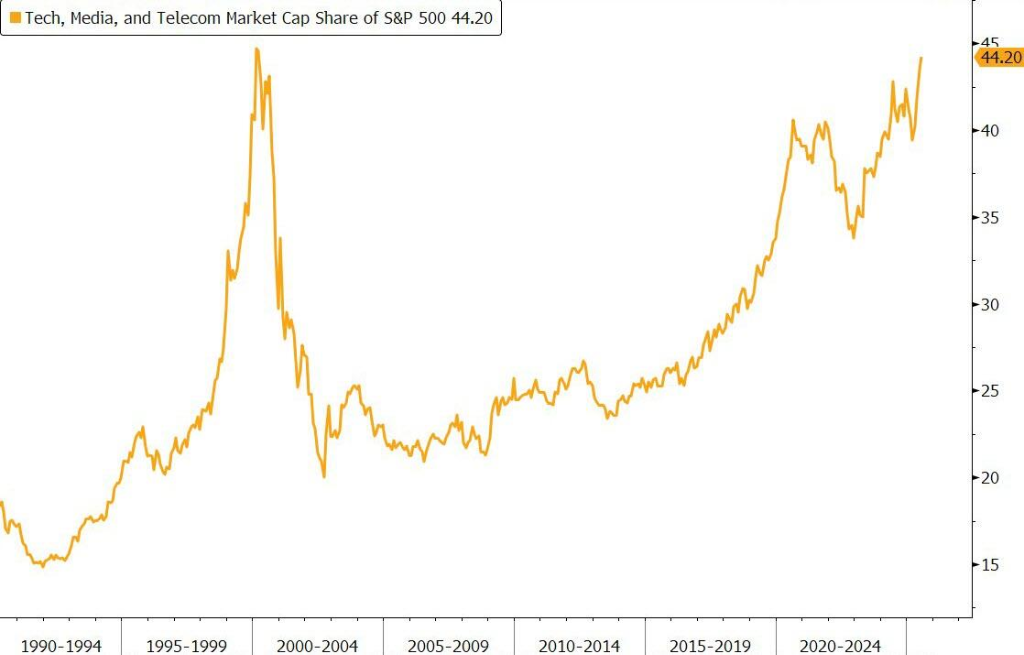
TMT now makes up 44.2% of the S&P 500’s market cap, almost matching the all-time high of 44.7% set in February 2000. That’s a sharp jump from 33.8% pre-COVID and well above the long-term average of 26.7%.
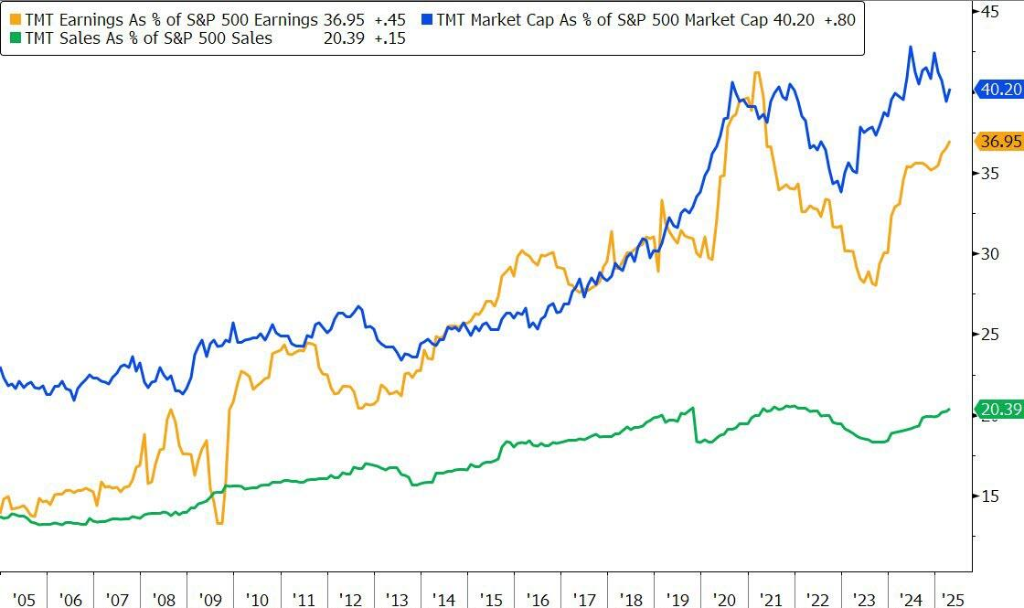
The top 10 companies in the index — mostly big tech — account for 33% of total market cap, yet their expected earnings contribution is closer to 25%. This gap shows investors are paying a much steeper premium for these giants compared to the rest of the market.
The Correlation Warning Sign
Another factor worth noting — and this one is subtle but important. The 26-week rolling pairwise correlation for TMT stocks is now 0.49, well above the long-term average and sharply higher than the 2024 low of 0.18. Historically, when correlations rebound from a bottom, sector pullbacks often follow within about six months.
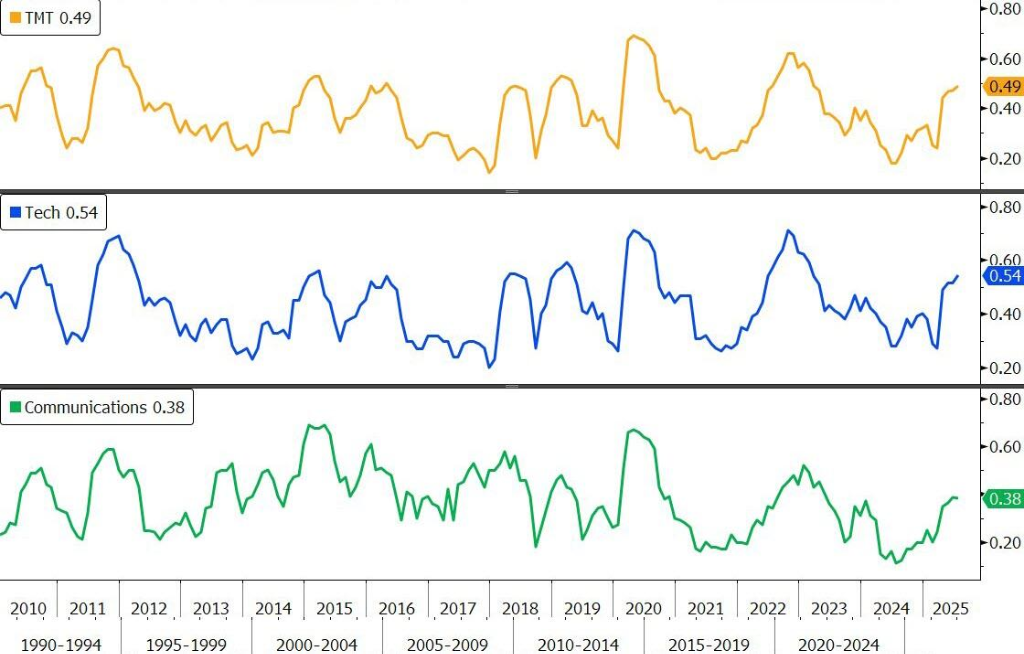
We saw this pattern in late 2017 (correlation bottom, pullback in mid-2018) and again in mid-2021 (bottom, then correction into early 2022). This time, correlations bottomed in mid-2024, and — right on cue — TMT began showing stress in early 2025. Elevated correlations often mean stocks are moving in lockstep, leaving less room for stock-picking to cushion a downturn.
Earnings Are Still The Anchor — For Now
Earnings momentum is what’s keeping this rally alive. Since Q3 2023, TMT earnings growth has outpaced the broader S&P 500. Analysts expect 11.8% growth in late 2025, nearly double the index’s 6.4%. But by 2026, that lead is projected to shrink to 15.5% vs 12.3%.
That kind of narrowing reduces the earnings premium investors are willing to pay. And high valuations are fragile — vulnerable to any earnings miss, policy shift, or sentiment change.
My Take
This isn’t 2000 all over again — back then, many companies had no earnings at all. Today’s tech leaders are profitable, cash-rich, and dominant in their fields. But valuation extremes, high concentration, and rising correlations have often preceded sector rotations in the past.
If earnings growth holds and AI-driven investment continues to deliver, TMT could keep leading. But if growth slows, rates stay higher for longer, or a macro shock hits, capital could rotate quickly into under-owned sectors like energy, industrials, or small caps.
So we’re at a fork in the road:
-
Scenario A: Tech keeps outperforming, premium stays justified.
-
Scenario B: Growth gap narrows, valuations get re-rated, money flows elsewhere.
For now, the strategy seems to be: ride the wave, but don’t ignore the undertow.
#U.S. Tech Giants: Tracking U.S. Market Leaders#$Apple Inc.(AAPL)#$Microsoft Corp(MSFT)#$Alphabet Inc. Class A Common Stock(GOOGL)#$Amazon.Com Inc(AMZN)#$Meta Platforms Inc. Class A Common Stock(META)#$Nvidia Corp(NVDA)#$Tesla Inc. Common Stock(TSLA)