
Margin Mystery at Scale: Can BYD Turn Soaring Exports into Real Profit?

BYD posted strong top-line growth in 2025 H1 — revenue hit ¥ 3,712.8 billion, up 23.3% year-on-year — yet second-quarter profitability weakened sharply. Q2 revenue rose to ¥ 2,009.2 billion (Q/Q +17.9%, Y/Y +14.0%), but attributable net income tumbled to ¥ 63.6 billion (Y/Y −29.8%, Q/Q −30.5%). The clash between scale and margin is now the central investor question:can growth translate into durable margins?

Morgan Stanley flagged an earnings “mystery”: robust overseas sales, better mix and favorable FX did not translate into stronger Q2 margins. Analysts are asking whether one-offs, elevated rebates, rising costs, or deliberate short-term provisioning explain the gap.
Key Points
- 2025 H1 revenue ¥ 3,712.8bn (+23.3% YoY); H1 attributable net profit ¥ 155.1bn (+13.8%).
- 2025 Q2 revenue ¥ 2,009.2bn (+14.0% YoY; +17.9% QoQ); Q2 attributable net profit ¥ 63.6bn (−8% YoY; −30.5% QoQ).
- Q2 gross margin fell to 16.3% (down 3.8ppt QoQ; down 2.4ppt YoY); H1 gross margin 18.01% vs prior-year 18.78%.
- Unit economics weakened: Q2 single-car gross profit ~¥ 25,728 (QoQ −¥ 6,107); single-car net profit ¥ 4,800.
- Overseas momentum is real: Q2 exports accounted for 22.5% of sales; Jan–Jul NEV exports 545k (+133.5% YoY).
- Morgan Stanley warns margins should have benefited from exports and FX, raising questions about one-off charges, rebates and rising costs.
What happened: growth up, margins down — what does the headline mean?
BYD’s top-line story is undeniable: H1 revenue surpassed Tesla for the first time and overall vehicle shipments rose. Q2 volumes reached 1.145 million units (+16.1% YoY; +14.4% QoQ), with high-end models and exports gaining share. Yet profitability slipped sharply in Q2, cutting single-vehicle profitability nearly in half versus Q1.
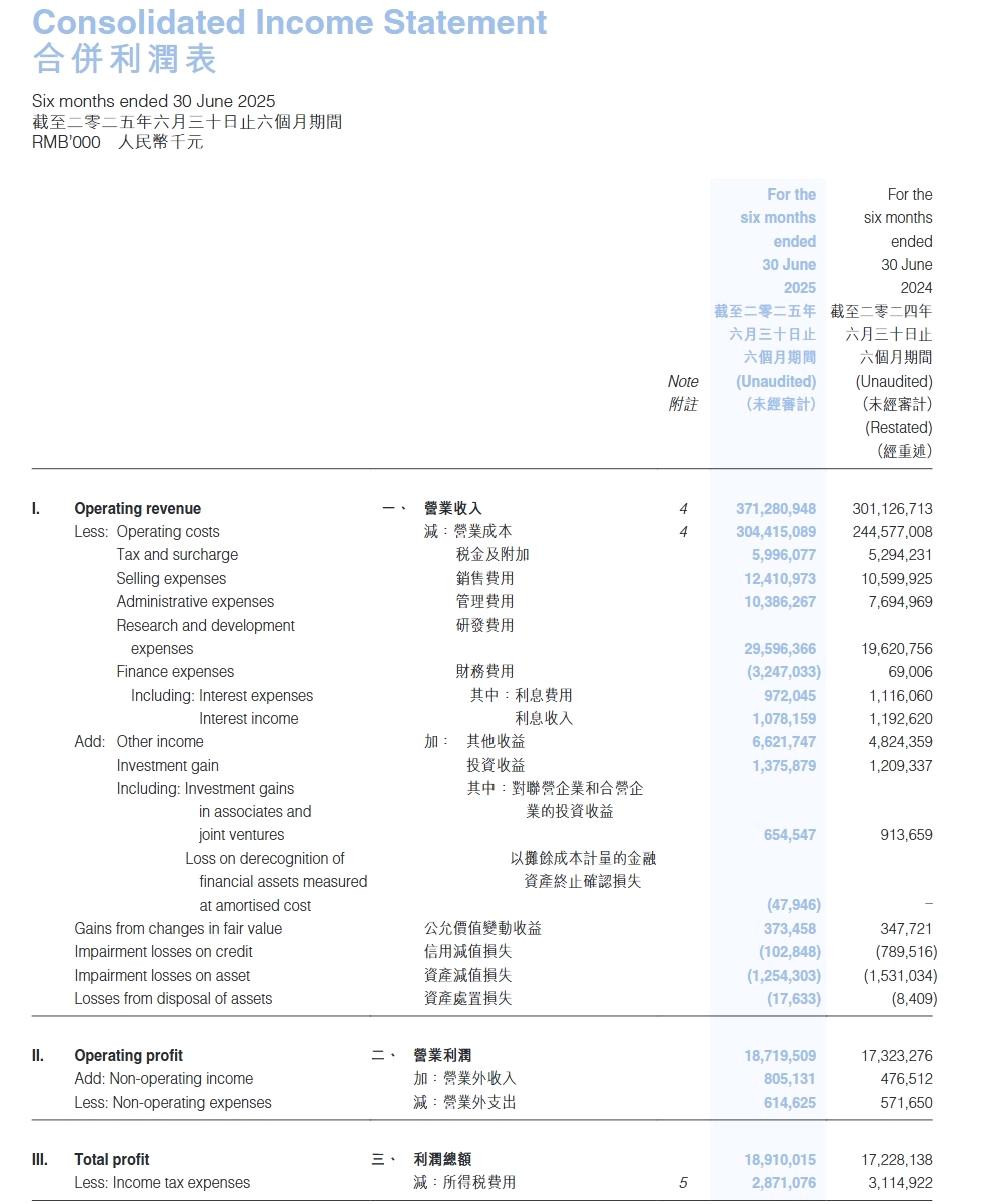
Management points to higher ASPs driven by overseas and premium mix, but unit-level gross and net profits fell. The immediate takeaway: scale alone did not protect profitability this quarter.
Why did margins compress so much — rebates, costs, or something else?
Morgan Stanley isolates three pressure points: generous dealer rebates, rising per-vehicle costs from higher-spec systems, and intensified domestic price competition. BYD increased incentives this year to sustain volume, which directly eroded per-car margins.
Second, advanced features such as the “Tianshen Eye” ADAS raise manufacturing cost per vehicle. Those content investments have product and strategic logic, but the hit to margin comes before full revenue payback.
Finally, intense price competition in China, plus late-April pricing moves by BYD, compressed profitability further.
How can exports be booming while profits fall — where’s the disconnect?
This is the heart of Morgan Stanley’s puzzle. BYD’s overseas expansion should lift average selling price, benefit from favorable FX in some markets, and deliver greater scale efficiencies. Instead, Q2 results show margin deterioration.
Possible explanations include concentrated, non-recurring charges booked in Q2, regional roll-out costs for new plants, or deliberate margin sacrifice to secure market share overseas. Management has not yet disclosed all granular drivers, leaving analysts to weigh these scenarios.
Are the overseas investments real and material to future margins?
Yes — BYD’s overseas footprint is expanding quickly. Jan–Jul NEV exports reached 545,000 units (+133.5% YoY). The company launched its seventh ro-ro vessel, “Zhengzhou,” in June, boosting logistics capacity. A Brazil passenger-car plant began production on July 1, 2025, and BYD is planning factories in Uzbekistan, Hungary, Turkey and Indonesia.
If those factories and distribution investments achieve scale, gross margins could recover through higher ASPs, localized cost improvements and lower shipping fees. But short-term investment and market-entry costs can depress margins while the network scales.
What do the unit economics tell us — single-car profit is slipping fast
Q2 single-car gross profit was ~¥ 25,728, a QoQ decline of ¥ 6,107. Q2 single-car net profit was ¥ 4,800, down sharply from Q1’s ¥ 8,800. That margin squeeze is meaningful: even after strong volume growth, profitability per vehicle is nearly halved, compressing corporate earnings.
Investors will need line-item transparency — rebate levels, R&D allocations to new features, and one-time charges — to judge whether per-unit profits will rebound.
How material are R&D and operating costs to the margin story?
BYD’s R&D intensity rose as headcount grew and fixed spending lifted. Q2 combined expense ratio across sales, G&A, R&D and finance was 12.8%, with R&D at 7.7%.
Those investments underpin long-term competitiveness in software and EV tech, but they also depress near-term margins.
Investors must balance the cost of building differentiated products against the immediate hit to earnings, and watch for the inflection point when R&D-driven product upgrades begin to generate higher ASPs and better margins.
Is management sacrificing margin for share — intentional or unavoidable?
Some margin erosion appears deliberate: heavier rebates and targeted price moves since April were designed to keep momentum in a competitive domestic market and win share abroad. That tactical trade-off can make sense if higher volumes later translate into stronger pricing power and scale efficiencies.
Yet Morgan Stanley warns that unexplained charges could reflect “earnings management” or a deliberate quarter-concentrated hit to clean up future periods. Until BYD clarifies, markets will discount the stock for uncertainty.
What does this mean for investors — risks and potential catalysts?
Near-term risks: persistent rebate-driven margin pressure, higher per-vehicle costs, and expanding opex tied to overseas buildouts. These could keep quarterly profits volatile.
Potential catalysts: clearer disclosure on one-offs; seasonal demand recovery; cost cuts announced at product launches; and visible profit contribution from overseas plants once they ramp. The upcoming Chengdu Auto Show and new model introductions are two events investors watch.
How is the market reacting — valuation and sentiment snapshot?
BYD’s Hong Kong shares have retraced from their intrayear peak (down ~27% from highs) but remain up ~29% year-to-date. That tug-of-war between bulls and bears likely persists: growth and strategic positioning argue for upside, while margin uncertainty provides ammunition to skeptics.
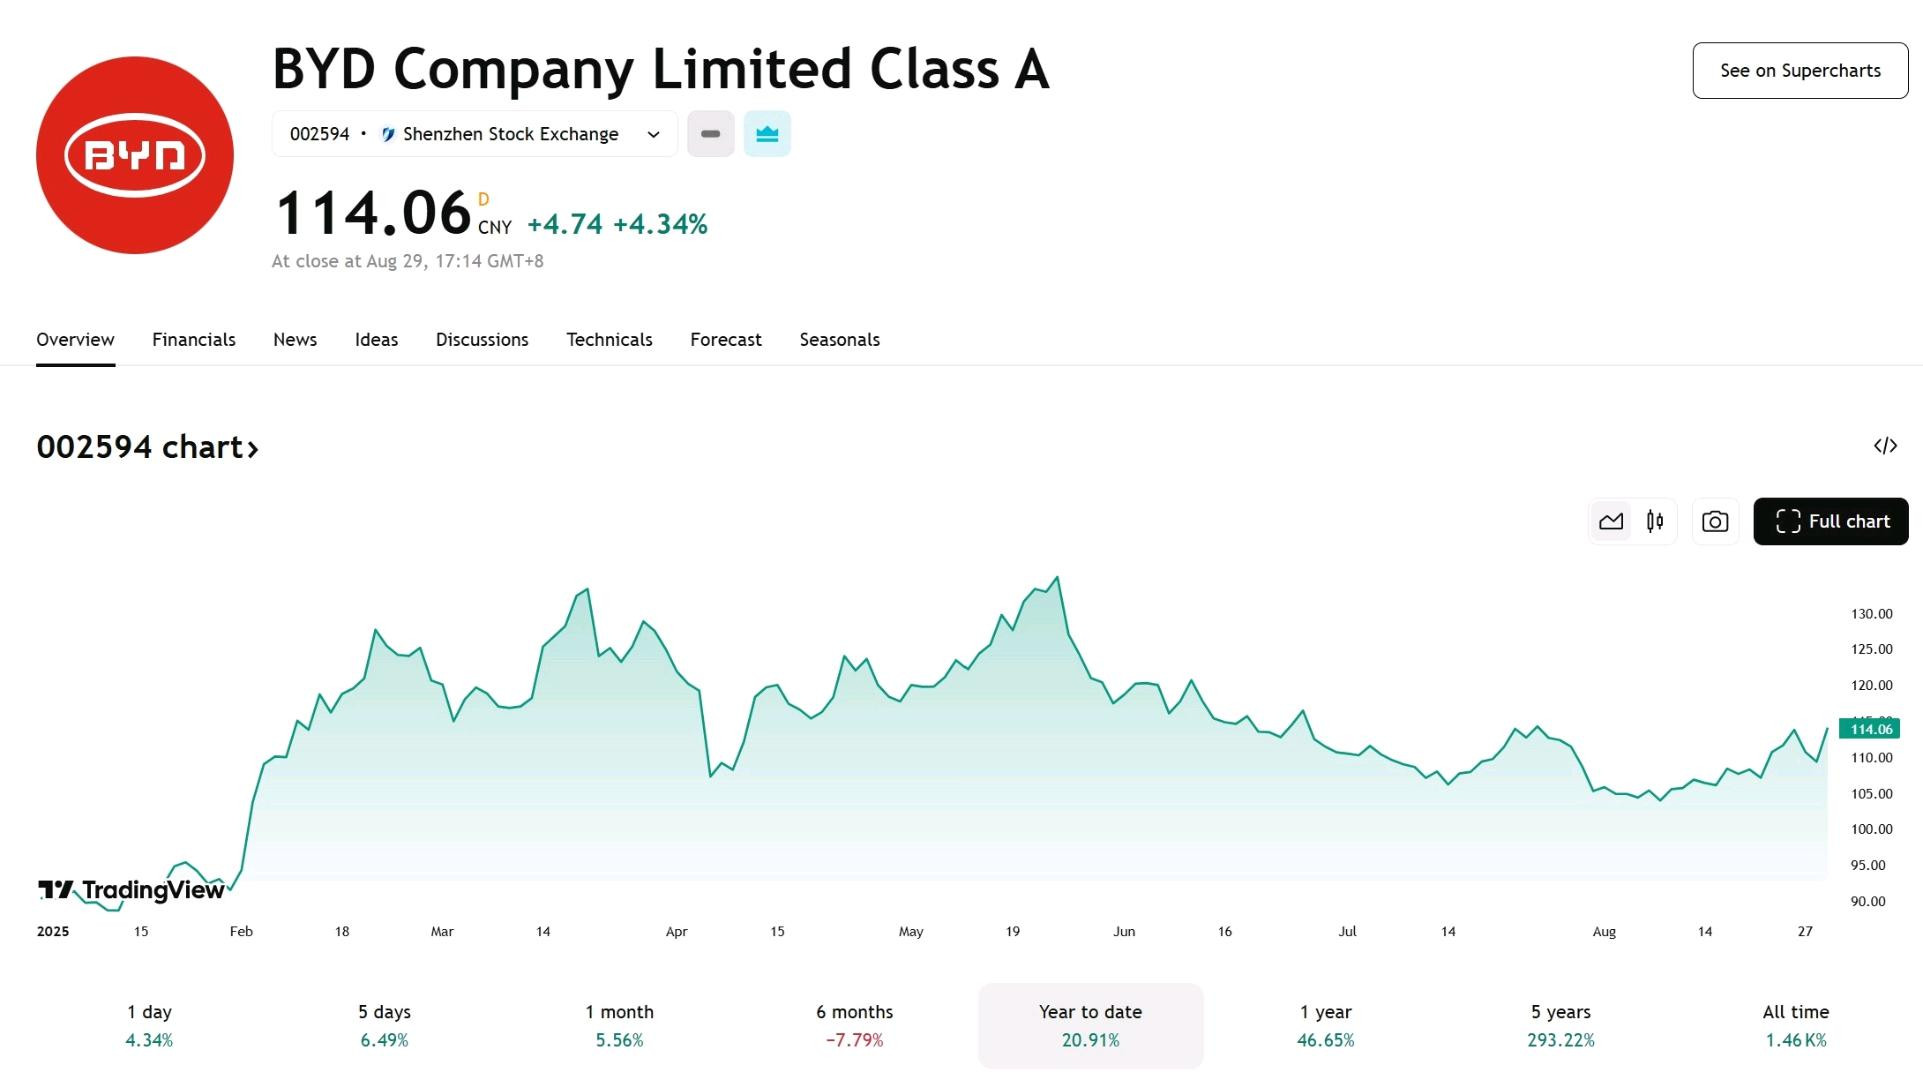
Morgan Stanley expects continued volatility and debate until BYD offers more granular explanations or margins recover demonstrably.
Bottom line — growing pains or structural problem?
BYD’s combination of rapid volume gains, rising ASPs, and a fast-moving global footprint makes it one of the most consequential EV stories. However, Q2’s sharp margin deterioration forces a reassessment: is this a temporary growth investment and pricing strategy, or a sign of deeper cost and competitive pressures?
Investors asking the right questions should press for transparency on rebates, one-off costs, the profitability of overseas shipments, and the timeline for margin recovery. If BYD converts its export momentum into consistent per-vehicle margins, the growth story remains intact. If not, valuations may be re-rated to reflect lower structural profitability.