Breaking 7000! S&P 500 Hits New Milestone — But Has the Market Leader Changed?

Wall Street notched another brag-worthy number on Wednesday…
Shortly after the open, the S&P 500 broke the 7000-point level for the first time in history, propelled by persistent buying that pushed the U.S. benchmark index to heights unimaginable to investors just a few decades ago.
Intraday data showed the S&P 500 reached a record high of 7002.28 during the session. Although it failed to close above 7000, the brief breakthrough still delivered a strong dose of confidence to many market participants.
President Trump celebrated the milestone on social media, declaring: “America is Back!!!”
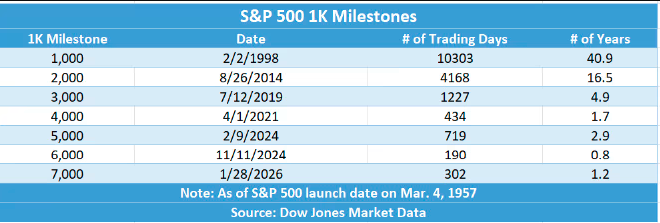
According to Dow Jones Market Data, Wednesday marked the 302nd trading day since the S&P 500 last crossed a 1000-point threshold — roughly 14 months after it first closed above 6000 on November 11, 2024. Some purists are still waiting for a close above 7000 to officially confirm the milestone on a historical basis.
One increasingly clear trend in recent years: the time between 1000-point milestones is shrinking dramatically.
- 5000 → 6000 took just 190 days
- 4000 → 5000 took 719 days
By contrast, 1000 → 2000 required 4168 trading days.
Good Things Take Time
While the pace of 1000-point advances has accelerated, investors who’ve lived through the past few months know this breakthrough wasn’t easy.
As the chart shows, the S&P 500 has largely traded in a range-bound box since last September.
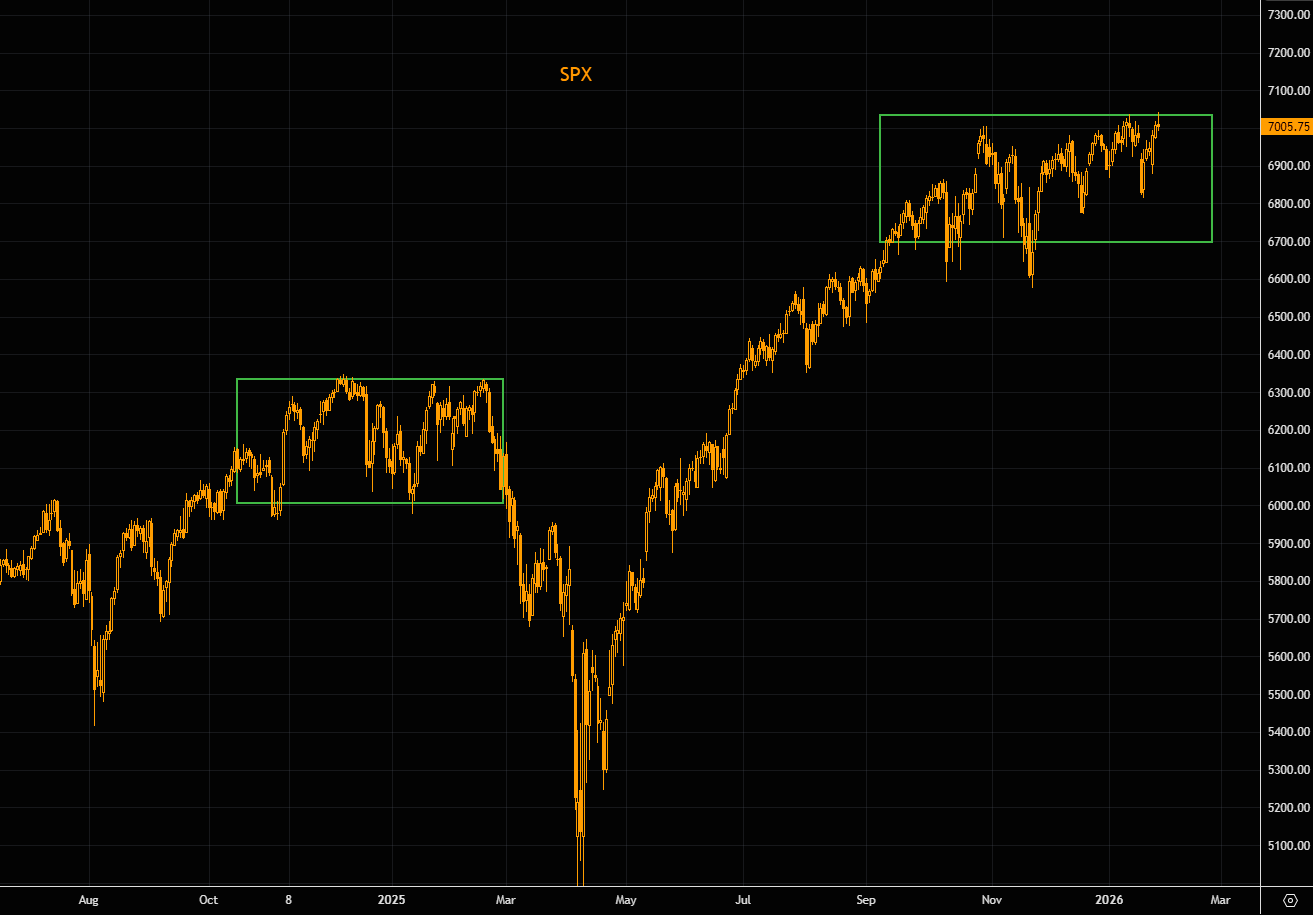
It peaked in late October, then faced a pullback amid renewed concerns over AI spending sustainability. Oracle, CoreWeave, and several Mag7 names sold off sharply, dragging the index down as much as 5.1% from its October high before rebounding to new highs by year-end.
In early 2026, Trump’s series of dramatic foreign-policy moves made the final sprint to 7000 bumpy: U.S. military action in Venezuela captured President Maduro and seized portions of the country’s oil revenue; in the past two weeks, Trump briefly revived tariff threats against European allies over their opposition to his Greenland annexation proposal.
Keith Lerner, Chief Investment Officer and Chief Market Strategist at Truist Advisory Services, commented: “Since last October, the market has basically been drifting in a 6900 ±50-point range.”
He noted that Wednesday’s break above the multi-month consolidation band boosted confidence and created positive technical momentum. On the 7000 milestone itself, Lerner said: “It’s not game-changing, but it brings more excitement and reinforces the signal that the bull trend remains intact.”
Has the Market Leader Shifted?
While the S&P 500 set a new record, the leadership of the market is quietly changing.
Deutsche Bank strategist Jim Reid wrote in his daily chart note that the most striking aspect of this peak is how much leadership has shifted over the past quarter.
Per Reid’s data, in the three months since tech peaked on October 29:
- Materials +14.9%
- Energy +13.3%
- Consumer Staples +8.5%
- Health Care +8.0%
- Industrials +6.5%
All outperformed by more than 5%. Of the S&P’s 11 major sectors, only two declined: Utilities (-3.6%) and Information Technology (-5.4%).
Given tech’s heavy weighting in the index, this explains why the S&P 500 “only” rose 1.3% over the same period.
Many market participants note that in recent weeks, investors have started rotating out of concentrated positions to capture upside from expectations of significantly stronger economic growth.
Jay Woods, Chief Market Strategist at Freedom Capital Markets, said: “The year started chaotic, but we’re seeing a major rotation. Stocks that typically don’t lead bull markets — energy, materials, staples — are now driving this leg higher.”
Also notable: FactSet data shows the small-cap Russell 2000 has led major U.S. indices in 2026 so far, up nearly 7% month-to-date vs. less than 2% for the S&P 500.
Small-caps’ outperformance reflects hopes for accelerated U.S. economic growth — smaller, domestically focused companies tend to benefit most when investors seek higher-growth, higher-risk names in a robust economy.
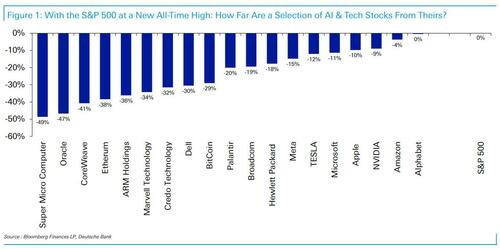
Whether tech can reclaim leadership remains an open question. Deutsche Bank’s chart highlights the gap between many tech/AI names and their historical highs (mostly set last summer). Given the short time frame, the drawdowns are significant — making the S&P 500’s current resilience even more noteworthy.
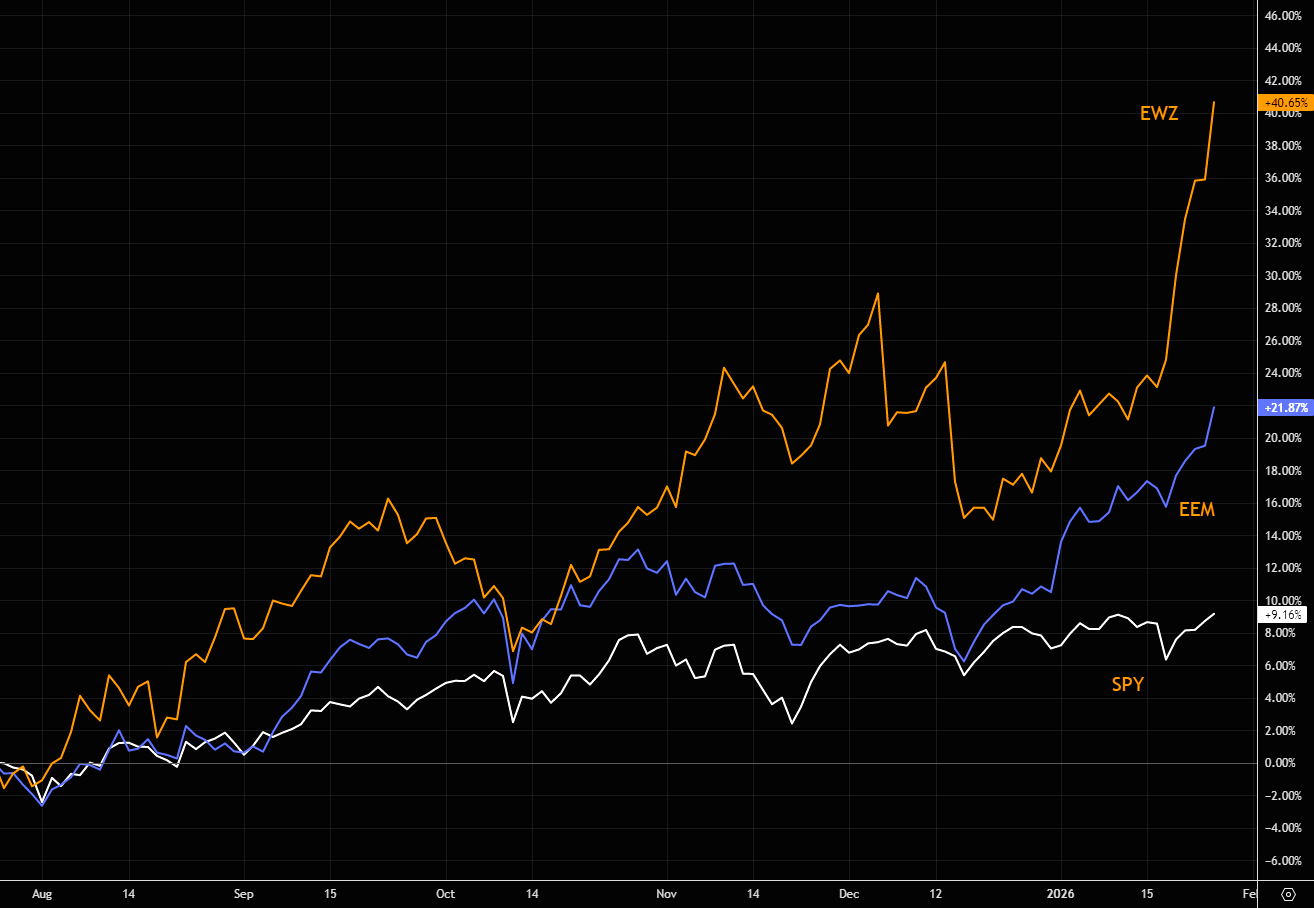
Finally, if you zoom out globally, even with the S&P 500’s historic breach of 7000, the U.S. market may no longer be the main “hot spot” globally this year.
As the chart shows, the relative strength between U.S. and emerging-market stocks is subtly reversing…
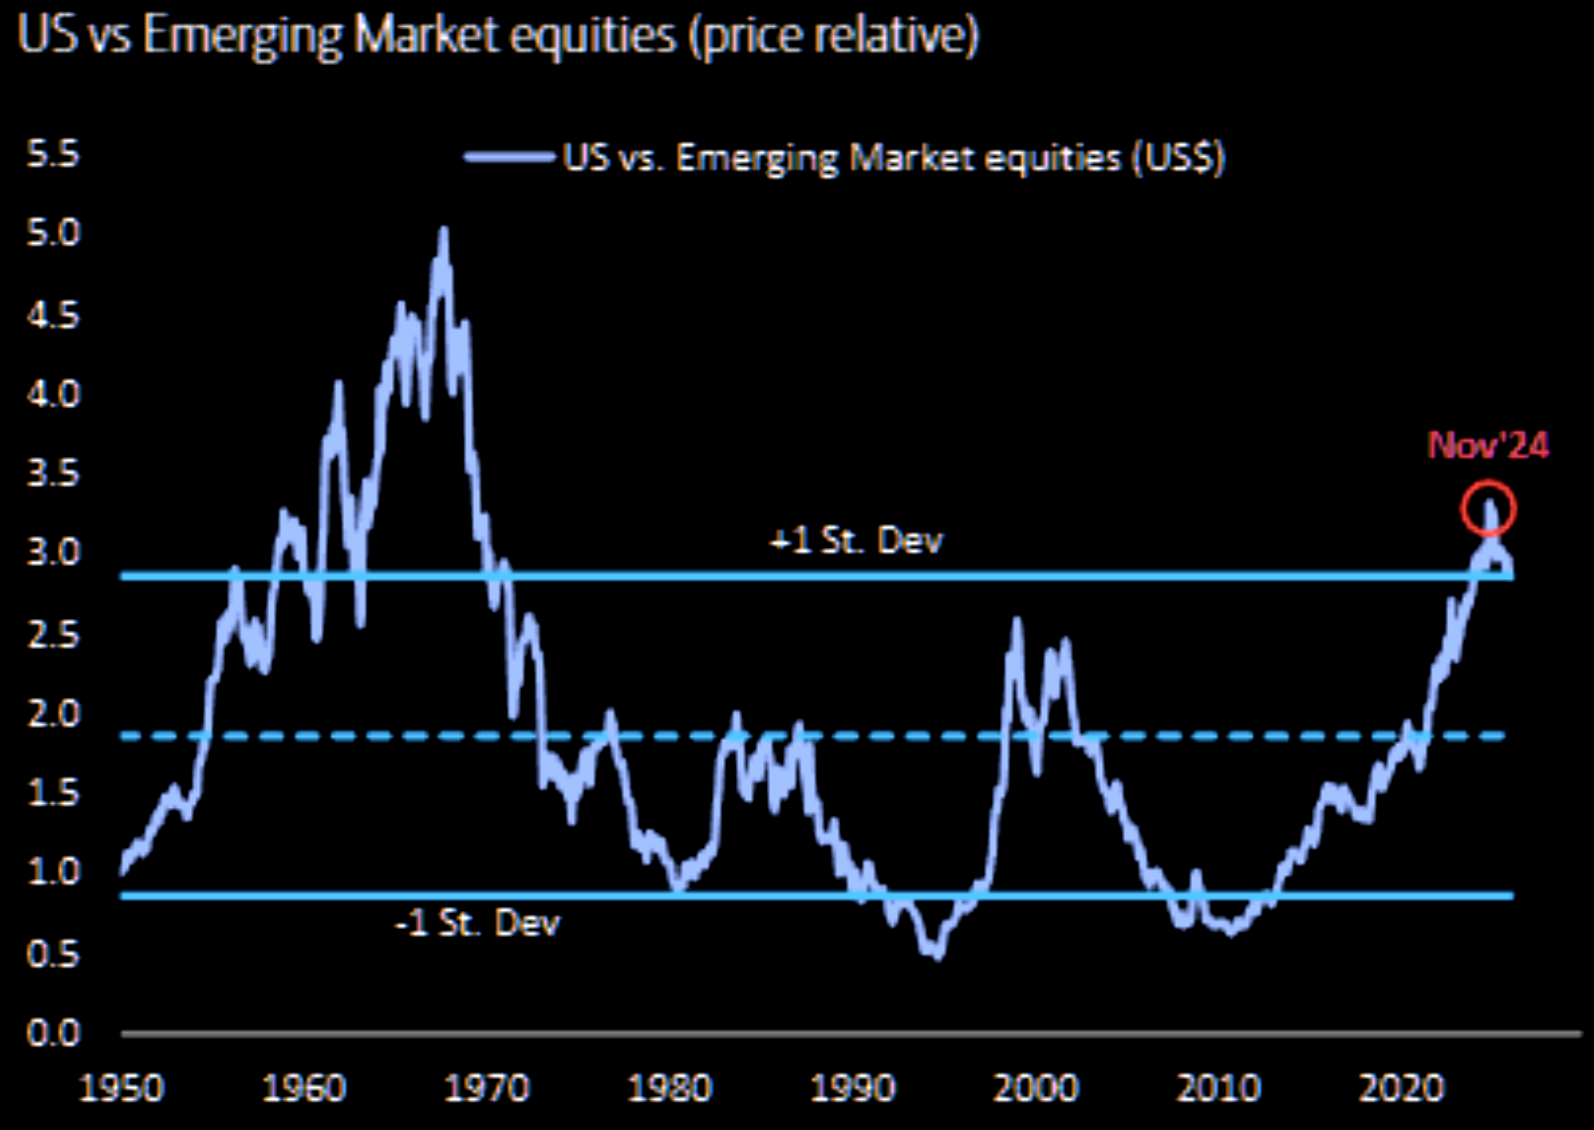
A recurring theme on Wall Street in recent months: instead of watching a “sleepy” U.S. market, look abroad for more excitement. The past six months say it all: Brazil ETF (EWZ) +41%, Emerging Markets ETF (EEM) +22%, while S&P 500 ETF (SPY) +9%.