読み込み中
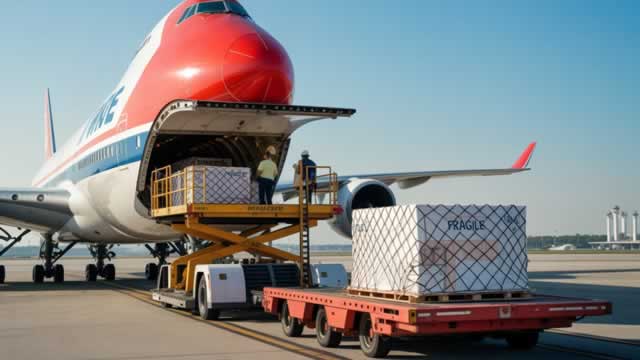
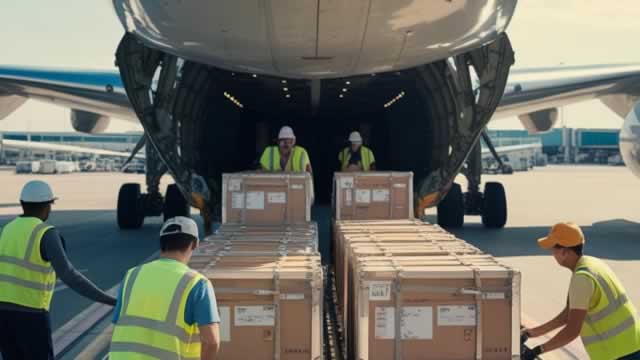
Air T, Inc. operates as a diversified company, offering an array of services across the United States and globally. Its primary business activities encompass rapid air cargo transportation, the manufacturing and sale of specialized ground support equipment, comprehensive solutions for commercial aircraft, engines, and parts, and services for printing equipment maintenance. The company's Overnight Air Cargo division specializes in expedited air freight delivery. As of March 31, 2022, this segment utilized a fleet of 72 aircraft, which were dry-leased for operations with FedEx. Through its Ground Equipment Sales segment, Air T, Inc. designs, produces, distributes, and maintains various types of specialized machinery. This includes aircraft de-icing units, elevated work platforms (scissor lifts), decontamination systems for both military and civilian use, flight-line tow tractors, and glycol recovery vehicles, among other unique equipment. Its broad customer base includes passenger and cargo airlines, ground handling companies, the United States Air Force, airport authorities, and industrial enterprises. The Commercial Aircraft, Engines and Parts segment provides an exhaustive suite of services related to commercial aviation assets. These offerings span commercial aircraft trading, leasing arrangements, and extensive parts solutions. Specific services include aircraft storage, maintenance during storage periods, and aircraft disassembly for component recovery (part-out services). Furthermore, this segment handles the sale, exchange, procurement, consignment programs, and overhaul/repair of aircraft components. Its expertise extends to instrumentation, avionics, and a variety of electrical accessories suitable for civilian, military transport, regional/commuter, business/commercial jet, and turboprop aircraft. The division also specializes in composite aircraft structures, providing both repair and support services for them. Air T, Inc. was established in 1980 and is headquartered in Denver, North Carolina.
終値時点
$30.64
+$0.265 · +0.87%
時間外
$30.64
$0.00 · 0.00%
10月12日 19:30 ET
日中の時刻はETです。市場データは遅延する場合があります。
Air T, Inc. operates as a diversified company, offering an array of services across the United States and globally. Its primary business activities encompass rapid air cargo transportation, the manufacturing and sale of specialized ground support equipment, comprehensive solutions for commercial aircraft, engines, and parts, and services for printing equipment maintenance. The company's Overnight Air Cargo division specializes in expedited air freight delivery. As of March 31, 2022, this segment utilized a fleet of 72 aircraft, which were dry-leased for operations with FedEx. Through its Ground Equipment Sales segment, Air T, Inc. designs, produces, distributes, and maintains various types of specialized machinery. This includes aircraft de-icing units, elevated work platforms (scissor lifts), decontamination systems for both military and civilian use, flight-line tow tractors, and glycol recovery vehicles, among other unique equipment. Its broad customer base includes passenger and cargo airlines, ground handling companies, the United States Air Force, airport authorities, and industrial enterprises. The Commercial Aircraft, Engines and Parts segment provides an exhaustive suite of services related to commercial aviation assets. These offerings span commercial aircraft trading, leasing arrangements, and extensive parts solutions. Specific services include aircraft storage, maintenance during storage periods, and aircraft disassembly for component recovery (part-out services). Furthermore, this segment handles the sale, exchange, procurement, consignment programs, and overhaul/repair of aircraft components. Its expertise extends to instrumentation, avionics, and a variety of electrical accessories suitable for civilian, military transport, regional/commuter, business/commercial jet, and turboprop aircraft. The division also specializes in composite aircraft structures, providing both repair and support services for them. Air T, Inc. was established in 1980 and is headquartered in Denver, North Carolina.
日中レンジ
現在 $30.64
52週レンジ
現在 $30.64
日中の時刻はETです。市場データは遅延する場合があります。
GoAI スコア
買い
バリュエーション
100
大幅な割安
センチメント
63
強気
リスク
54
やや高いリスク
モメンタム
84
強い上昇
GoAIの詳細リサーチ
詳しい根拠、カタリスト、リスクを確認できます。
Air T, Inc. operates as a diversified company, offering an array of services across the United States and globally. Its primary business activities encompass rapid air cargo transportation, the manufacturing and sale of specialized ground support equipment, comprehensive solutions for commercial aircraft, engines, and parts, and services for printing equipment maintenance. The company's Overnight Air Cargo division specializes in expedited air freight delivery. As of March 31, 2022, this segment utilized a fleet of 72 aircraft, which were dry-leased for operations with FedEx. Through its Ground Equipment Sales segment, Air T, Inc. designs, produces, distributes, and maintains various types of specialized machinery. This includes aircraft de-icing units, elevated work platforms (scissor lifts), decontamination systems for both military and civilian use, flight-line tow tractors, and glycol recovery vehicles, among other unique equipment. Its broad customer base includes passenger and cargo airlines, ground handling companies, the United States Air Force, airport authorities, and industrial enterprises. The Commercial Aircraft, Engines and Parts segment provides an exhaustive suite of services related to commercial aviation assets. These offerings span commercial aircraft trading, leasing arrangements, and extensive parts solutions. Specific services include aircraft storage, maintenance during storage periods, and aircraft disassembly for component recovery (part-out services). Furthermore, this segment handles the sale, exchange, procurement, consignment programs, and overhaul/repair of aircraft components. Its expertise extends to instrumentation, avionics, and a variety of electrical accessories suitable for civilian, military transport, regional/commuter, business/commercial jet, and turboprop aircraft. The division also specializes in composite aircraft structures, providing both repair and support services for them. Air T, Inc. was established in 1980 and is headquartered in Denver, North Carolina.
日中レンジ
現在 $30.64
52週レンジ
現在 $30.64
利用可能な期間全体で報告されたマージン。
売上高
営業利益
純利益
| 指標(USD) | 2026年度 | 2025年度 | 2024年度 | 2023年度 | 2022年度 |
|---|---|---|---|---|---|
| 売上高 | 3.27億 USD | 2.92億 USD | 2.87億 USD | 2.47億 USD | 1.77億 USD |
| 売上原価 | 2.65億 USD | 2.32億 USD | 2.34億 USD | 1.98億 USD | 1.38億 USD |
| 粗利益 | 6194.3万 USD | 6019.1万 USD | 5237.8万 USD | 4882.5万 USD | 3938.2万 USD |
| 販売・一般管理 | 8084万 USD | 5784.8万 USD | 5111.4万 USD | 4284.4万 USD | 2981.7万 USD |
| 営業費用 | 8084万 USD | 5828.3万 USD | 5111.4万 USD | 5323.2万 USD | 3062.7万 USD |
| 受取利息 | 74.8万 USD | 37.5万 USD | 9.2万 USD | 32.8万 USD | 22.7万 USD |
| 支払利息 | 1279万 USD | 892.9万 USD | 700.8万 USD | 826.3万 USD | 517.5万 USD |
| 減価償却費と償却費 | 1234万 USD | 435.6万 USD | 279.8万 USD | 416.2万 USD | 186万 USD |
| 営業利益 | −1889.7万 USD | 190.8万 USD | 126.4万 USD | −440.7万 USD | 875.5万 USD |
| 純利益 | 7798.3万 USD | −614万 USD | −681.9万 USD | −1229.5万 USD | 1092.8万 USD |
会社概要が更新されました 2026年10月13日.
直近の発表実績
直近の発表実績
分割調整後の1株当たりの年間現金分配金。
$0.30
2013年(通年)-9.1% 以来 2009
$0.33
2,009
$0.33
2,010
$0.25
2,011
$0.25
2,012
$0.30
2,013
| 種別 | 配当落ち日 | 詳細 | 基準日 | 支払日 |
|---|---|---|---|---|
配当 | 2013年6月5日 | $0.30Annual | 2013年6月7日 | 2013年6月28日 |
配当 | 2012年6月6日 | $0.25Annual | 2012年6月8日 | 2012年6月29日 |
配当 | 2011年6月1日 | $0.25Annual | 2011年6月3日 | 2011年6月24日 |
配当 | 2010年6月2日 | $0.33Annual | 2010年6月4日 | 2010年6月25日 |
配当 | 2009年6月3日 | $0.33Annual | 2009年6月5日 | 2009年6月26日 |
配当 | 2008年6月4日 | $0.30Annual | 2008年6月6日 | 2008年6月27日 |
配当落ち 2013年6月5日
$0.30
Annual
2013年6月7日基準 · 支払日 2013年6月28日
配当落ち 2012年6月6日
$0.25
Annual
2012年6月8日基準 · 支払日 2012年6月29日
配当落ち 2011年6月1日
$0.25
Annual
2011年6月3日基準 · 支払日 2011年6月24日
配当落ち 2010年6月2日
$0.33
Annual
2010年6月4日基準 · 支払日 2010年6月25日
配当落ち 2009年6月3日
$0.33
Annual
2009年6月5日基準 · 支払日 2009年6月26日
配当落ち 2008年6月4日
$0.30
Annual
2008年6月6日基準 · 支払日 2008年6月27日
この株式へのエクスポージャーを報告している上場投資信託です。
AIが生成した遅延市場データを、情報提供および教育目的で掲載しています。投資助言ではありません。