読み込み中
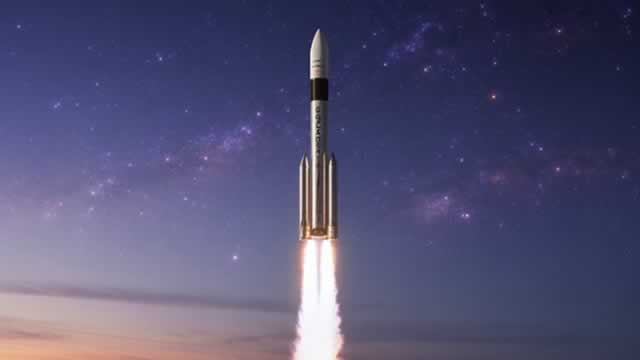
Space Exploration Technologies Corp. designs, manufactures, and launches rockets and spacecraft, and provides satellite-based broadband services in the United States, Ireland, and Canada. The company offers launch services for satellites, cargo, and crew to destinations such as low Earth orbit, the International Space Station, the Moon, and Mars, using vehicles, including Falcon 9, Falcon Heavy, and Starship. It provides dedicated rideshare missions for small satellites, manufactures reusable rockets and spacecraft, such as Dragon and Starship, and conducts suborbital and orbital flight tests. The company supplies broadband internet connectivity through the Starlink satellite network for consumer and commercial use, and offers Starshield, a satellite-based solution for government users focused on sensing, communications, and satellite bus services. It supports scientific research opportunities and provides on-orbit research and travel services for private and government customers, and collaborates with government agencies for national security space launch missions. The company serves government agencies, national security organizations, commercial satellite operators, research institutions, and private spaceflight clients, supporting scientific research and commercial payload missions for professional and industrial clients in the aerospace and telecommunications sectors. The company was founded in 2002 and is based in Starbase, Texas.

NASDAQIndustrialsAerospace & Defense
最新データ
$163.5
+$0.9299 · +0.57%
通常取引
$163.5
+$0.9299 · +0.57%
日中の時刻はETです。市場データは遅延する場合があります。
Space Exploration Technologies Corp. designs, manufactures, and launches rockets and spacecraft, and provides satellite-based broadband services in the United States, Ireland, and Canada. The company offers launch services for satellites, cargo, and crew to destinations such as low Earth orbit, the International Space Station, the Moon, and Mars, using vehicles, including Falcon 9, Falcon Heavy, and Starship. It provides dedicated rideshare missions for small satellites, manufactures reusable rockets and spacecraft, such as Dragon and Starship, and conducts suborbital and orbital flight tests. The company supplies broadband internet connectivity through the Starlink satellite network for consumer and commercial use, and offers Starshield, a satellite-based solution for government users focused on sensing, communications, and satellite bus services. It supports scientific research opportunities and provides on-orbit research and travel services for private and government customers, and collaborates with government agencies for national security space launch missions. The company serves government agencies, national security organizations, commercial satellite operators, research institutions, and private spaceflight clients, supporting scientific research and commercial payload missions for professional and industrial clients in the aerospace and telecommunications sectors. The company was founded in 2002 and is based in Starbase, Texas.
日中レンジ
現在 $163.5
52週レンジ
現在 $163.5
日中の時刻はETです。市場データは遅延する場合があります。
Space Exploration Technologies Corp. designs, manufactures, and launches rockets and spacecraft, and provides satellite-based broadband services in the United States, Ireland, and Canada. The company offers launch services for satellites, cargo, and crew to destinations such as low Earth orbit, the International Space Station, the Moon, and Mars, using vehicles, including Falcon 9, Falcon Heavy, and Starship. It provides dedicated rideshare missions for small satellites, manufactures reusable rockets and spacecraft, such as Dragon and Starship, and conducts suborbital and orbital flight tests. The company supplies broadband internet connectivity through the Starlink satellite network for consumer and commercial use, and offers Starshield, a satellite-based solution for government users focused on sensing, communications, and satellite bus services. It supports scientific research opportunities and provides on-orbit research and travel services for private and government customers, and collaborates with government agencies for national security space launch missions. The company serves government agencies, national security organizations, commercial satellite operators, research institutions, and private spaceflight clients, supporting scientific research and commercial payload missions for professional and industrial clients in the aerospace and telecommunications sectors. The company was founded in 2002 and is based in Starbase, Texas.
日中レンジ
現在 $163.5
52週レンジ
現在 $163.5
利用可能な期間全体で報告されたマージン。
売上高
営業利益
純利益
| 指標(USD) | 2025年度 | 2024年度 | 2023年度 |
|---|---|---|---|
| 売上高 | 186.74億 USD | 140.15億 USD | 103.87億 USD |
| 売上原価 | 94.51億 USD | 79.96億 USD | 61.1億 USD |
| 粗利益 | 92.23億 USD | 60.19億 USD | 42.77億 USD |
| 研究開発 | 86.43億 USD | 34.64億 USD | 21.05億 USD |
| 販売・一般管理 | 26.44億 USD | 18.13億 USD | 16.65億 USD |
| 営業費用 | 118.12億 USD | 55.53億 USD | 77.82億 USD |
| 受取利息 | 4.92億 USD | 3.71億 USD | 2.49億 USD |
| 支払利息 | 19.45億 USD | 15.8億 USD | 16.93億 USD |
| 減価償却費と償却費 | 67.01億 USD | 38.24億 USD | 26.35億 USD |
| 営業利益 | −25.89億 USD | 4.66億 USD | −35.05億 USD |
| 純利益 | −49.37億 USD | 7.91億 USD | −46.28億 USD |
会社概要が更新されました 2026年10月12日.
直近の発表実績
直近の発表実績
第三者のアナリスト予想は変更される場合があり、GoAIの推奨ではありません。
平均目標
$211.43
上昇余地(29.32%)この株式へのエクスポージャーを報告している上場投資信託です。
 Invesco QQQ Trust, Series 1QQQ145.48億2.87%5060.67億 USD0.18%$746.3-0.66%
 Invesco NASDAQ 100 ETFQQQM32.36億2.88%1125.33億 USD0.15%$307.27-0.69%
 Vanguard Morningstar Total Stock Market ETFVTI26.96億0.11%2.3兆 USD0.03%$381.8-0.04%
 Vanguard Extended Market ETFVXF9.86億1.01%954億 USD0.05%$234.39-0.26%
 Vanguard Morningstar Growth ETFVUG9.24億0.24%3846億 USD0.03%$91.775-0.21%
 JPMorgan Nasdaq Equity Premium Income ETFJEPQ6.15億1.38%446.95億 USD0.35%$60.9472-0.23%
 iShares A.I. Innovation and Tech Active ETFBAI4.83億3.27%147.41億 USD0.65%$46.905-2.67%
 ARK Innovation ETFARKK4.54億6.60%55.62億 USD0.75%$88.47-1.28%Invesco QQQ Trust, Series 1QQQInvesco NASDAQ 100 ETFQQQMVanguard Morningstar Total Stock Market ETFVTIVanguard Extended Market ETFVXFVanguard Morningstar Growth ETFVUGJPMorgan Nasdaq Equity Premium Income ETFJEPQiShares A.I. Innovation and Tech Active ETFBAIARK Innovation ETFARKK
AIが生成した遅延市場データを、情報提供および教育目的で掲載しています。投資助言ではありません。