読み込み中
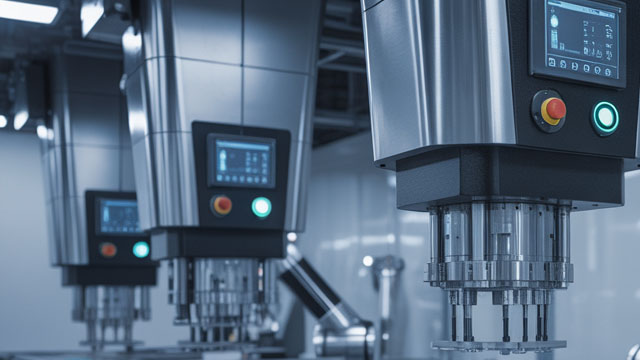
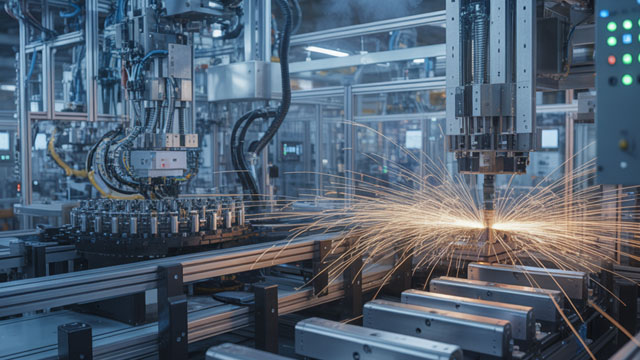
The Gorman-Rupp Company specializes in the design, production, and distribution of a broad spectrum of pumps and associated systems, serving markets both within the United States and globally. Their comprehensive portfolio encompasses a wide array of pump types, such as self-priming, standard, and magnetic drive centrifugal units; axial and mixed flow designs; vertical turbine line shaft, submersible, and high-pressure booster pumps; alongside rotary gear, diaphragm, bellows, and oscillating models. These versatile solutions are essential across numerous sectors, including municipal water and wastewater management, building and infrastructure projects, dewatering operations, diverse industrial processes, the petroleum industry, original equipment manufacturing (OEM), agricultural irrigation, fire suppression systems, military applications, and general fluid transfer, including heating, ventilating, and air conditioning (HVAC). To reach its diverse clientele, the company employs a multi-channel sales strategy, leveraging an established network of distributors and independent manufacturers' representatives, sales via third-party catalogs, direct engagement with customers, and e-commerce platforms. Established in 1933, The Gorman-Rupp Company maintains its corporate headquarters in Mansfield, Ohio.
終値時点
$73.04
−$1.17 · -1.58%
時間外
$73.04
$0.00 · 0.00%
10月8日 16:01 ET
日中の時刻はETです。市場データは遅延する場合があります。
The Gorman-Rupp Company specializes in the design, production, and distribution of a broad spectrum of pumps and associated systems, serving markets both within the United States and globally. Their comprehensive portfolio encompasses a wide array of pump types, such as self-priming, standard, and magnetic drive centrifugal units; axial and mixed flow designs; vertical turbine line shaft, submersible, and high-pressure booster pumps; alongside rotary gear, diaphragm, bellows, and oscillating models. These versatile solutions are essential across numerous sectors, including municipal water and wastewater management, building and infrastructure projects, dewatering operations, diverse industrial processes, the petroleum industry, original equipment manufacturing (OEM), agricultural irrigation, fire suppression systems, military applications, and general fluid transfer, including heating, ventilating, and air conditioning (HVAC). To reach its diverse clientele, the company employs a multi-channel sales strategy, leveraging an established network of distributors and independent manufacturers' representatives, sales via third-party catalogs, direct engagement with customers, and e-commerce platforms. Established in 1933, The Gorman-Rupp Company maintains its corporate headquarters in Mansfield, Ohio.
日中レンジ
現在 $73.04
52週レンジ
現在 $73.04
日中の時刻はETです。市場データは遅延する場合があります。
GoAI スコア
中立
バリュエーション
71
割安
センチメント
68
強気
リスク
42
やや高いリスク
モメンタム
58
中立
GoAIの詳細リサーチ
詳しい根拠、カタリスト、リスクを確認できます。
The Gorman-Rupp Company specializes in the design, production, and distribution of a broad spectrum of pumps and associated systems, serving markets both within the United States and globally. Their comprehensive portfolio encompasses a wide array of pump types, such as self-priming, standard, and magnetic drive centrifugal units; axial and mixed flow designs; vertical turbine line shaft, submersible, and high-pressure booster pumps; alongside rotary gear, diaphragm, bellows, and oscillating models. These versatile solutions are essential across numerous sectors, including municipal water and wastewater management, building and infrastructure projects, dewatering operations, diverse industrial processes, the petroleum industry, original equipment manufacturing (OEM), agricultural irrigation, fire suppression systems, military applications, and general fluid transfer, including heating, ventilating, and air conditioning (HVAC). To reach its diverse clientele, the company employs a multi-channel sales strategy, leveraging an established network of distributors and independent manufacturers' representatives, sales via third-party catalogs, direct engagement with customers, and e-commerce platforms. Established in 1933, The Gorman-Rupp Company maintains its corporate headquarters in Mansfield, Ohio.
日中レンジ
現在 $73.04
52週レンジ
現在 $73.04
利用可能な期間全体で報告されたマージン。
売上高
営業利益
純利益
| 指標(USD) | 2025年度 | 2024年度 | 2023年度 | 2022年度 | 2021年度 |
|---|---|---|---|---|---|
| 売上高 | 6.82億 USD | 6.6億 USD | 6.6億 USD | 5.21億 USD | 3.78億 USD |
| 売上原価 | 4.86億 USD | 4.68億 USD | 4.63億 USD | 3.9億 USD | 2.82億 USD |
| 粗利益 | 1.97億 USD | 1.92億 USD | 1.96億 USD | 1.31億 USD | 9589.7万 USD |
| 販売・一般管理 | 1.01億 USD | 1.02億 USD | 9666万 USD | 8311.7万 USD | 5654.1万 USD |
| 営業費用 | 1.01億 USD | 1.02億 USD | 1.09億 USD | 9075.4万 USD | 5654.1万 USD |
| 支払利息 | 2339.6万 USD | 3362.1万 USD | 4127.3万 USD | 1924万 USD | — |
| 減価償却費と償却費 | 2770.9万 USD | 2789.7万 USD | 2849.6万 USD | 2115.8万 USD | 1191.4万 USD |
| 営業利益 | 9536.3万 USD | 9024.8万 USD | 8704.1万 USD | 4018.3万 USD | 3935.6万 USD |
| 純利益 | 5301.7万 USD | 4011.5万 USD | 3495.1万 USD | 1119.5万 USD | 2985.1万 USD |
会社概要が更新されました 2026年10月8日.
直近の発表実績
直近の発表実績
第三者のアナリスト予想は変更される場合があり、GoAIの推奨ではありません。
評価サンプルは3件と限定的です
分割調整後の1株当たりの年間現金分配金。
$0.745
2025年(通年)+17.3% 以来 2021
2026年(一部):$0.57
$0.635
2,021
$0.685
2,022
$0.705
2,023
$0.725
2,024
$0.745
2,025
$0.57
2,026*
* 利用可能な配当履歴のうち、暦年の一部のみを含みます。
| 種別 | 配当落ち日 | 詳細 | 基準日 | 支払日 |
|---|---|---|---|---|
配当 | 2026年8月14日 | $0.19Quarterly | 2026年8月14日 | 2026年9月10日 |
配当 | 2026年5月15日 | $0.19Quarterly | 2026年5月15日 | 2026年6月10日 |
配当 | 2026年2月13日 | $0.19Quarterly | 2026年2月13日 | 2026年3月10日 |
配当 | 2025年11月14日 | $0.19Quarterly | 2025年11月14日 | 2025年12月10日 |
配当 | 2025年8月15日 | $0.185Quarterly | 2025年8月15日 | 2025年9月10日 |
配当 | 2025年5月15日 | $0.185Quarterly | 2025年5月15日 | 2025年6月10日 |
配当落ち 2026年8月14日
$0.19
Quarterly
2026年8月14日基準 · 支払日 2026年9月10日
配当落ち 2026年5月15日
$0.19
Quarterly
2026年5月15日基準 · 支払日 2026年6月10日
配当落ち 2026年2月13日
$0.19
Quarterly
2026年2月13日基準 · 支払日 2026年3月10日
配当落ち 2025年11月14日
$0.19
Quarterly
2025年11月14日基準 · 支払日 2025年12月10日
配当落ち 2025年8月15日
$0.185
Quarterly
2025年8月15日基準 · 支払日 2025年9月10日
配当落ち 2025年5月15日
$0.185
Quarterly
2025年5月15日基準 · 支払日 2025年6月10日
この株式へのエクスポージャーを報告している上場投資信託です。
 Vanguard Morningstar Total Stock Market ETFVTI5081.6万0.00%2.3兆 USD0.03%$379.56-0.39%
 Global X - U.S. Infrastructure Development ETFPAVE4272.63万0.31%139.5億 USD0.47%$53.25-0.08%
 iShares Russell 2000 ETFIWM4170.65万0.05%785.63億 USD0.19%$277.57-0.05%
 Vanguard Morningstar Small-Cap ETFVB3662.74万0.02%1853億 USD0.03%$287.63+0.23%
 Gabelli Love Our Planet & People ETFLOPP2848.9万1.95%1460万 USD0.90%$35.66-0.14%
 Dimensional - US Small Cap ETFDFAS2380.98万0.07%336.6億 USD0.31%$78.10+0.23%
 Vanguard Extended Market ETFVXF1824.79万0.02%954億 USD0.05%$233.13-0.15%
 iShares Russell 2000 Growth ETFIWO1478.4万0.11%142.49億 USD0.24%$353.47-0.53%Vanguard Morningstar Total Stock Market ETFVTIGlobal X - U.S. Infrastructure Development ETFPAVEiShares Russell 2000 ETFIWMVanguard Morningstar Small-Cap ETFVBGabelli Love Our Planet & People ETFLOPPDimensional - US Small Cap ETFDFASVanguard Extended Market ETFVXFiShares Russell 2000 Growth ETFIWO
AIが生成した遅延市場データを、情報提供および教育目的で掲載しています。投資助言ではありません。