読み込み中
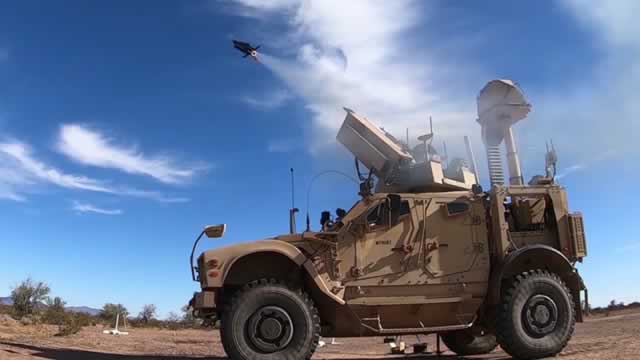
RTX Corporation, a major player in the aerospace and defense sectors, provides sophisticated systems and extensive services to a diverse global clientele. This includes commercial entities, military organizations, and government agencies, both within the United States and internationally. The company's operations are divided into three primary business units: Collins Aerospace, Pratt & Whitney, and Raytheon. The Collins Aerospace segment delivers a broad range of aerospace and defense products, alongside comprehensive aftermarket support solutions. Its customer base spans manufacturers of civil and military aircraft, commercial airlines, and operators in regional, business, general aviation, defense, and commercial space ventures. This division's offerings cover the design, production, and maintenance of aircraft interior components, such as oxygen systems, food and beverage preparation and storage facilities, galley systems, and lavatory and wastewater management. It also supplies battlespace management tools, test and training range infrastructure, crew escape mechanisms, simulation and training programs, and essential information management services. Its post-sales services include providing spare parts, overhaul and repair, specialized engineering and technical assistance, training and fleet management, and integrated asset and information management. Pratt & Whitney, another core segment, is a leading provider of aircraft propulsion systems for commercial airliners, military aircraft, business jets, and general aviation. This division is also responsible for manufacturing, selling, and maintaining auxiliary power units for both military and commercial applications. Finally, the Raytheon segment specializes in creating advanced capabilities for the detection, tracking, and mitigation of both defensive and offensive threats. Its tailored solutions serve the U.S. government, foreign governments, and various commercial customers. Established in 1934, the company was formerly known as Raytheon Technologies Corporation before officially rebranding as RTX Corporation in July 2023. RTX Corporation maintains its corporate headquarters in Arlington, Virginia.
前日終値
$184.32
+$4.06 · +2.25%
時間外
$185.29
+$0.97 · +0.53%
10月8日 19:52 ET
日中の時刻はETです。市場データは遅延する場合があります。
RTX Corporation, a major player in the aerospace and defense sectors, provides sophisticated systems and extensive services to a diverse global clientele. This includes commercial entities, military organizations, and government agencies, both within the United States and internationally. The company's operations are divided into three primary business units: Collins Aerospace, Pratt & Whitney, and Raytheon. The Collins Aerospace segment delivers a broad range of aerospace and defense products, alongside comprehensive aftermarket support solutions. Its customer base spans manufacturers of civil and military aircraft, commercial airlines, and operators in regional, business, general aviation, defense, and commercial space ventures. This division's offerings cover the design, production, and maintenance of aircraft interior components, such as oxygen systems, food and beverage preparation and storage facilities, galley systems, and lavatory and wastewater management. It also supplies battlespace management tools, test and training range infrastructure, crew escape mechanisms, simulation and training programs, and essential information management services. Its post-sales services include providing spare parts, overhaul and repair, specialized engineering and technical assistance, training and fleet management, and integrated asset and information management. Pratt & Whitney, another core segment, is a leading provider of aircraft propulsion systems for commercial airliners, military aircraft, business jets, and general aviation. This division is also responsible for manufacturing, selling, and maintaining auxiliary power units for both military and commercial applications. Finally, the Raytheon segment specializes in creating advanced capabilities for the detection, tracking, and mitigation of both defensive and offensive threats. Its tailored solutions serve the U.S. government, foreign governments, and various commercial customers. Established in 1934, the company was formerly known as Raytheon Technologies Corporation before officially rebranding as RTX Corporation in July 2023. RTX Corporation maintains its corporate headquarters in Arlington, Virginia.
日中レンジ
現在 $184.32
52週レンジ
現在 $184.32
日中の時刻はETです。市場データは遅延する場合があります。
GoAI スコア
買い
バリュエーション
89
大幅な割安
センチメント
70
強気
リスク
20
低リスク
モメンタム
47
中立
GoAIの詳細リサーチ
詳しい根拠、カタリスト、リスクを確認できます。
RTX Corporation, a major player in the aerospace and defense sectors, provides sophisticated systems and extensive services to a diverse global clientele. This includes commercial entities, military organizations, and government agencies, both within the United States and internationally. The company's operations are divided into three primary business units: Collins Aerospace, Pratt & Whitney, and Raytheon. The Collins Aerospace segment delivers a broad range of aerospace and defense products, alongside comprehensive aftermarket support solutions. Its customer base spans manufacturers of civil and military aircraft, commercial airlines, and operators in regional, business, general aviation, defense, and commercial space ventures. This division's offerings cover the design, production, and maintenance of aircraft interior components, such as oxygen systems, food and beverage preparation and storage facilities, galley systems, and lavatory and wastewater management. It also supplies battlespace management tools, test and training range infrastructure, crew escape mechanisms, simulation and training programs, and essential information management services. Its post-sales services include providing spare parts, overhaul and repair, specialized engineering and technical assistance, training and fleet management, and integrated asset and information management. Pratt & Whitney, another core segment, is a leading provider of aircraft propulsion systems for commercial airliners, military aircraft, business jets, and general aviation. This division is also responsible for manufacturing, selling, and maintaining auxiliary power units for both military and commercial applications. Finally, the Raytheon segment specializes in creating advanced capabilities for the detection, tracking, and mitigation of both defensive and offensive threats. Its tailored solutions serve the U.S. government, foreign governments, and various commercial customers. Established in 1934, the company was formerly known as Raytheon Technologies Corporation before officially rebranding as RTX Corporation in July 2023. RTX Corporation maintains its corporate headquarters in Arlington, Virginia.
日中レンジ
現在 $184.32
52週レンジ
現在 $184.32
利用可能な期間全体で報告されたマージン。
売上高
営業利益
純利益
| 指標(USD) | 2025年度 | 2024年度 | 2023年度 | 2022年度 | 2021年度 |
|---|---|---|---|---|---|
| 売上高 | 886.03億 USD | 807.38億 USD | 689.2億 USD | 670.74億 USD | 643.88億 USD |
| 売上原価 | 708.14億 USD | 653.28億 USD | 568.31億 USD | 534.06億 USD | 518.97億 USD |
| 粗利益 | 177.89億 USD | 154.1億 USD | 120.89億 USD | 136.68億 USD | 124.91億 USD |
| 研究開発 | 28.07億 USD | 29.34億 USD | 28.05億 USD | 27.11億 USD | 27.32億 USD |
| 販売・一般管理 | 60.95億 USD | 58.06億 USD | 58.09億 USD | 55.73億 USD | 50.46億 USD |
| 営業費用 | 84.89億 USD | 88.72億 USD | 85.28億 USD | 81.64億 USD | 73.55億 USD |
| 受取利息 | 9800万 USD | 1.02億 USD | 1億 USD | 7000万 USD | 3600万 USD |
| 支払利息 | 18.35億 USD | 19.7億 USD | 16.53億 USD | 13億 USD | 13.3億 USD |
| 減価償却費と償却費 | 43.78億 USD | 43.64億 USD | 42.11億 USD | 41.08億 USD | 45.57億 USD |
| 営業利益 | 93億 USD | 65.38億 USD | 35.61億 USD | 55.04億 USD | 51.36億 USD |
| 純利益 | 67.32億 USD | 47.74億 USD | 31.95億 USD | 51.97億 USD | 38.64億 USD |
会社概要が更新されました 2026年10月9日.
直近の発表実績
直近の発表実績
第三者のアナリスト予想は変更される場合があり、GoAIの推奨ではありません。
分割調整後の1株当たりの年間現金分配金。
$2.67
2025年(通年)+33.2% 以来 2021
2026年(一部):$2.14
$2.005
2,021
$2.16
2,022
$2.32
2,023
$2.48
2,024
$2.67
2,025
$2.14
2,026*
* 利用可能な配当履歴のうち、暦年の一部のみを含みます。
| 種別 | 配当落ち日 | 詳細 | 基準日 | 支払日 |
|---|---|---|---|---|
配当 | 2026年8月14日 | $0.73Quarterly | 2026年8月14日 | 2026年9月3日 |
配当 | 2026年5月22日 | $0.73Quarterly | 2026年5月22日 | 2026年6月11日 |
配当 | 2026年2月20日 | $0.68Quarterly | 2026年2月20日 | 2026年3月19日 |
配当 | 2025年11月21日 | $0.68Quarterly | 2025年11月21日 | 2025年12月11日 |
配当 | 2025年8月15日 | $0.68Quarterly | 2025年8月15日 | 2025年9月4日 |
配当 | 2025年5月23日 | $0.68Quarterly | 2025年5月23日 | 2025年6月12日 |
配当落ち 2026年8月14日
$0.73
Quarterly
2026年8月14日基準 · 支払日 2026年9月3日
配当落ち 2026年5月22日
$0.73
Quarterly
2026年5月22日基準 · 支払日 2026年6月11日
配当落ち 2026年2月20日
$0.68
Quarterly
2026年2月20日基準 · 支払日 2026年3月19日
配当落ち 2025年11月21日
$0.68
Quarterly
2025年11月21日基準 · 支払日 2025年12月11日
配当落ち 2025年8月15日
$0.68
Quarterly
2025年8月15日基準 · 支払日 2025年9月4日
配当落ち 2025年5月23日
$0.68
Quarterly
2025年5月23日基準 · 支払日 2025年6月12日
この株式へのエクスポージャーを報告している上場投資信託です。
 State Street SPDR S&P 500 ETF1557.T4680.12億0.36%129.69兆 JPY0.09%¥122,650-0.04%
 Vanguard Morningstar Total Stock Market ETFVTI88.9億0.38%2.3兆 USD0.03%$379.56-0.39%
 Vanguard S&P 500 ETFVOO74.32億0.42%1.8兆 USD0.03%$711.28-0.43%
 iShares Core S&P 500 ETFIVV32.32億0.36%8972.05億 USD0.03%$777.27-0.42%
 State Street SPDR S&P 500 ETFSPY29.59億0.36%8215.35億 USD0.09%$773.93-0.42%
 Vanguard Morningstar Value ETFVTV26.74億1.02%2624億 USD0.03%$219.63+0.65%
 iShares U.S. Aerospace & Defense ETFITA18.92億15.99%118.74億 USD0.37%$204.88+0.63%
 State Street Industrial Select Sector SPDR ETFXLI14.33億4.55%308.47億 USD0.08%$168.4+0.33%State Street SPDR S&P 500 ETF1557.TVanguard Morningstar Total Stock Market ETFVTIVanguard S&P 500 ETFVOOiShares Core S&P 500 ETFIVVState Street SPDR S&P 500 ETFSPYVanguard Morningstar Value ETFVTViShares U.S. Aerospace & Defense ETFITAState Street Industrial Select Sector SPDR ETFXLI
AIが生成した遅延市場データを、情報提供および教育目的で掲載しています。投資助言ではありません。