読み込み中
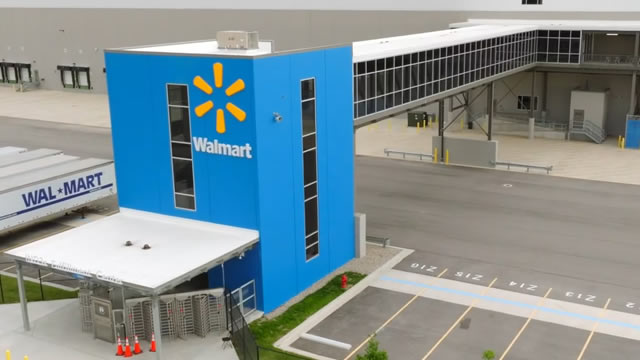
Walmart Inc., established in 1945 and based in Bentonville, Arkansas, operates as a global retail powerhouse, having officially adopted its current name in February 2018, formerly Wal-Mart Stores, Inc. The company's diverse operations, encompassing retail, wholesale, and e-commerce, are managed across three primary divisions: Walmart U.S., Walmart International, and Sam's Club. Its extensive physical presence includes a variety of store formats such as supercenters, supermarkets, hypermarkets, membership-only warehouse clubs (like Sam's Club), cash-and-carry outlets, and discount stores, primarily operating under the Walmart and Walmart Neighborhood Market banners. Digitally, the company engages customers through numerous e-commerce platforms, including walmart.com.mx, walmart.ca, flipkart.com, and PhonePe, as well as via dedicated mobile applications. Walmart offers an exceptionally broad range of products and services. Its inventory covers groceries and daily consumables, such as dairy, meats, baked goods, deli items, fresh produce, various packaged foods (dry, chilled, or frozen), alcoholic and non-alcoholic beverages, floral items, snacks, candies, health and beauty aids, paper products, laundry and home care essentials, baby care, and pet supplies, alongside fuel and tobacco. Furthermore, it features a comprehensive health and wellness segment, providing pharmacy, optical, and hearing services, over-the-counter medications, and other medical products. For home and personal needs, shoppers can find items ranging from home improvement goods, outdoor living products, gardening supplies, furniture, apparel, and jewelry, to tools, power equipment, housewares, toys, seasonal items, mattresses, and automotive services like tire and battery centers. The electronics department includes consumer electronics, accessories, software, video games, office supplies, appliances, and third-party gift cards. Beyond merchandise, Walmart provides a suite of financial services. These include digital payment platforms, money transfer options, bill payment services, money orders, check cashing, prepaid access solutions, co-branded credit cards, installment lending, and earned wage access programs. The company also markets several proprietary brands, notably Allswell, Athletic Works, Equate, and Free Assembly.
前日終値
$111.35
+$0.79 · +0.71%
日中の時刻はETです。市場データは遅延する場合があります。
Walmart Inc., established in 1945 and based in Bentonville, Arkansas, operates as a global retail powerhouse, having officially adopted its current name in February 2018, formerly Wal-Mart Stores, Inc. The company's diverse operations, encompassing retail, wholesale, and e-commerce, are managed across three primary divisions: Walmart U.S., Walmart International, and Sam's Club. Its extensive physical presence includes a variety of store formats such as supercenters, supermarkets, hypermarkets, membership-only warehouse clubs (like Sam's Club), cash-and-carry outlets, and discount stores, primarily operating under the Walmart and Walmart Neighborhood Market banners. Digitally, the company engages customers through numerous e-commerce platforms, including walmart.com.mx, walmart.ca, flipkart.com, and PhonePe, as well as via dedicated mobile applications. Walmart offers an exceptionally broad range of products and services. Its inventory covers groceries and daily consumables, such as dairy, meats, baked goods, deli items, fresh produce, various packaged foods (dry, chilled, or frozen), alcoholic and non-alcoholic beverages, floral items, snacks, candies, health and beauty aids, paper products, laundry and home care essentials, baby care, and pet supplies, alongside fuel and tobacco. Furthermore, it features a comprehensive health and wellness segment, providing pharmacy, optical, and hearing services, over-the-counter medications, and other medical products. For home and personal needs, shoppers can find items ranging from home improvement goods, outdoor living products, gardening supplies, furniture, apparel, and jewelry, to tools, power equipment, housewares, toys, seasonal items, mattresses, and automotive services like tire and battery centers. The electronics department includes consumer electronics, accessories, software, video games, office supplies, appliances, and third-party gift cards. Beyond merchandise, Walmart provides a suite of financial services. These include digital payment platforms, money transfer options, bill payment services, money orders, check cashing, prepaid access solutions, co-branded credit cards, installment lending, and earned wage access programs. The company also markets several proprietary brands, notably Allswell, Athletic Works, Equate, and Free Assembly.
日中レンジ
現在 $111.35
52週レンジ
現在 $111.35
日中の時刻はETです。市場データは遅延する場合があります。
GoAI スコア
買い
バリュエーション
78
割安
センチメント
65
強気
リスク
22
中程度のリスク
モメンタム
37
弱含み
GoAIの詳細リサーチ
詳しい根拠、カタリスト、リスクを確認できます。
Walmart Inc., established in 1945 and based in Bentonville, Arkansas, operates as a global retail powerhouse, having officially adopted its current name in February 2018, formerly Wal-Mart Stores, Inc. The company's diverse operations, encompassing retail, wholesale, and e-commerce, are managed across three primary divisions: Walmart U.S., Walmart International, and Sam's Club. Its extensive physical presence includes a variety of store formats such as supercenters, supermarkets, hypermarkets, membership-only warehouse clubs (like Sam's Club), cash-and-carry outlets, and discount stores, primarily operating under the Walmart and Walmart Neighborhood Market banners. Digitally, the company engages customers through numerous e-commerce platforms, including walmart.com.mx, walmart.ca, flipkart.com, and PhonePe, as well as via dedicated mobile applications. Walmart offers an exceptionally broad range of products and services. Its inventory covers groceries and daily consumables, such as dairy, meats, baked goods, deli items, fresh produce, various packaged foods (dry, chilled, or frozen), alcoholic and non-alcoholic beverages, floral items, snacks, candies, health and beauty aids, paper products, laundry and home care essentials, baby care, and pet supplies, alongside fuel and tobacco. Furthermore, it features a comprehensive health and wellness segment, providing pharmacy, optical, and hearing services, over-the-counter medications, and other medical products. For home and personal needs, shoppers can find items ranging from home improvement goods, outdoor living products, gardening supplies, furniture, apparel, and jewelry, to tools, power equipment, housewares, toys, seasonal items, mattresses, and automotive services like tire and battery centers. The electronics department includes consumer electronics, accessories, software, video games, office supplies, appliances, and third-party gift cards. Beyond merchandise, Walmart provides a suite of financial services. These include digital payment platforms, money transfer options, bill payment services, money orders, check cashing, prepaid access solutions, co-branded credit cards, installment lending, and earned wage access programs. The company also markets several proprietary brands, notably Allswell, Athletic Works, Equate, and Free Assembly.
日中レンジ
現在 $111.35
52週レンジ
現在 $111.35
利用可能な期間全体で報告されたマージン。
売上高
営業利益
純利益
| 指標(USD) | 2026年度 | 2025年度 | 2024年度 | 2023年度 | 2022年度 |
|---|---|---|---|---|---|
| 売上高 | 7131.63億 USD | 6809.85億 USD | 6481.25億 USD | 6112.89億 USD | 5727.54億 USD |
| 売上原価 | 5353.95億 USD | 5117.53億 USD | 4901.42億 USD | 4637.21億 USD | 4290億 USD |
| 粗利益 | 1777.68億 USD | 1692.32億 USD | 1579.83億 USD | 1475.68億 USD | 1437.54億 USD |
| 販売・一般管理 | 1479.43億 USD | 1398.84億 USD | 1309.71億 USD | 1271.4億 USD | 1178.12億 USD |
| 営業費用 | 1479.43億 USD | 1398.84億 USD | 1309.71億 USD | 1271.4億 USD | 1178.12億 USD |
| 受取利息 | 3.68億 USD | 4.83億 USD | 5.46億 USD | 2.54億 USD | 1.58億 USD |
| 支払利息 | 27.99億 USD | 27.28億 USD | 26.83億 USD | 21.28億 USD | 19.94億 USD |
| 減価償却費と償却費 | 142.03億 USD | 129.73億 USD | 118.53億 USD | 109.45億 USD | 106.58億 USD |
| 営業利益 | 298.25億 USD | 293.48億 USD | 270.12億 USD | 204.28億 USD | 259.42億 USD |
| 純利益 | 218.93億 USD | 194.36億 USD | 155.11億 USD | 116.8億 USD | 136.73億 USD |
会社概要が更新されました 2026年10月11日.
直近の発表実績
直近の発表実績
第三者のアナリスト予想は変更される場合があり、GoAIの推奨ではありません。
平均目標
$128.84
上昇余地(15.71%)価格履歴は利用できません
最高:$155平均:$128.84最低:$110この株式へのエクスポージャーを報告している上場投資信託です。
 State Street SPDR S&P 500 ETF1557.T9528.16億0.74%129.35兆 JPY0.09%¥122,850+0.12%
 Vanguard Morningstar Total Stock Market ETFVTI146.11億0.62%2.3兆 USD0.03%$381.94+0.63%
 Vanguard S&P 500 ETFVOO122.14億0.69%1.8兆 USD0.03%$715.59+0.61%
 Invesco QQQ Trust, Series 1QQQ112.96億2.23%5060.67億 USD0.18%$751.27+0.49%
 iShares Core S&P 500 ETFIVV65.5億0.74%8964.4億 USD0.03%$781.97+0.60%
 State Street SPDR S&P 500 ETFSPY60.19億0.74%8172億 USD0.09%$778.57+0.60%
 Vanguard Morningstar Value ETFVTV43.94億1.67%2624億 USD0.03%$220.59+0.44%
 Vanguard Dividend Appreciation ETFVIG26.03億1.96%1324億 USD0.04%$239.05+0.70%State Street SPDR S&P 500 ETF1557.TVanguard Morningstar Total Stock Market ETFVTIVanguard S&P 500 ETFVOOInvesco QQQ Trust, Series 1QQQiShares Core S&P 500 ETFIVVState Street SPDR S&P 500 ETFSPYVanguard Morningstar Value ETFVTVVanguard Dividend Appreciation ETFVIG
AIが生成した遅延市場データを、情報提供および教育目的で掲載しています。投資助言ではありません。