Loading
Apple Inc. is a global technology corporation that specializes in the conceptualization, production, and sale of a diverse suite of electronic devices. Its comprehensive hardware lineup features the well-known iPhone smartphones, Mac personal computers, and versatile iPad tablets. The company also supplies a range of wearables, smart home products, and accessories, including AirPods, Apple TV, Apple Watch, items from the Beats brand, and HomePod speakers. Beyond its device offerings, Apple delivers essential support services like AppleCare and robust cloud solutions. It oversees key digital platforms, prominently the App Store, which acts as a central hub for customers to discover and download countless applications and digital content, from e-books and music to videos, games, and podcasts. The company also generates revenue via advertising, leveraging both its proprietary ad platforms and third-party licensing deals. Apple's ecosystem is further bolstered by a wide array of subscription-based services: Apple Arcade for gaming, Apple Fitness+ for personalized wellness, Apple Music for curated audio experiences and on-demand radio, Apple News+ for access to news and magazines, and Apple TV+ for exclusive original video programming. Its financial services portfolio includes the co-branded Apple Card and the mobile payment system, Apple Pay. Additionally, Apple strategically licenses its intellectual property. The company serves a broad clientele that spans individual consumers, small and medium-sized enterprises, as well as institutional clients in the education, corporate, and governmental sectors. Products are distributed through a multi-channel strategy, utilizing Apple's own physical retail locations and online storefronts, a dedicated direct sales team, and collaborations with external partners such as mobile network providers, wholesalers, general retailers, and authorized resellers. The App Store additionally functions as the primary conduit for third-party applications designed for its devices. Founded in 1976, Apple Inc. is headquartered in Cupertino, California.
Latest quote
$336.67
+$3.04 · +0.91%
After-hours
$336.52
−$0.1545 · -0.05%
Oct 7, 7:59 PM ET
Regular session · ET · Market data may be delayed.
GoAI Score
Buy
Valuation
75
Undervalued
Sentiment
55
Mixed
Risk
24
Moderate Risk
Momentum
61
Gaining
Full GoAI research
Thesis, catalysts, evidence, and risk analysis.
Apple Inc. is a global technology corporation that specializes in the conceptualization, production, and sale of a diverse suite of electronic devices. Its comprehensive hardware lineup features the well-known iPhone smartphones, Mac personal computers, and versatile iPad tablets. The company also supplies a range of wearables, smart home products, and accessories, including AirPods, Apple TV, Apple Watch, items from the Beats brand, and HomePod speakers. Beyond its device offerings, Apple delivers essential support services like AppleCare and robust cloud solutions. It oversees key digital platforms, prominently the App Store, which acts as a central hub for customers to discover and download countless applications and digital content, from e-books and music to videos, games, and podcasts. The company also generates revenue via advertising, leveraging both its proprietary ad platforms and third-party licensing deals. Apple's ecosystem is further bolstered by a wide array of subscription-based services: Apple Arcade for gaming, Apple Fitness+ for personalized wellness, Apple Music for curated audio experiences and on-demand radio, Apple News+ for access to news and magazines, and Apple TV+ for exclusive original video programming. Its financial services portfolio includes the co-branded Apple Card and the mobile payment system, Apple Pay. Additionally, Apple strategically licenses its intellectual property. The company serves a broad clientele that spans individual consumers, small and medium-sized enterprises, as well as institutional clients in the education, corporate, and governmental sectors. Products are distributed through a multi-channel strategy, utilizing Apple's own physical retail locations and online storefronts, a dedicated direct sales team, and collaborations with external partners such as mobile network providers, wholesalers, general retailers, and authorized resellers. The App Store additionally functions as the primary conduit for third-party applications designed for its devices. Founded in 1976, Apple Inc. is headquartered in Cupertino, California.
Day range
Current $336.67
52-week range
Current $336.67
Profitability as a percentage of reported revenue.
Revenue
Operating income
Net income
| Metric (USD) | FY2025 | FY2024 | FY2023 | FY2022 | FY2021 |
|---|---|---|---|---|---|
| Revenue | 416.16B USD | 391.04B USD | 383.29B USD | 394.33B USD | 365.82B USD |
| Cost of goods sold | 220.96B USD | 210.35B USD | 214.14B USD | 223.55B USD | 212.98B USD |
| Gross profit | 195.2B USD | 180.68B USD | 169.15B USD | 170.78B USD | 152.84B USD |
| Research and development | 34.55B USD | 31.37B USD | 29.92B USD | 26.25B USD | 21.91B USD |
| Selling, general, and administrative | 27.6B USD | 26.1B USD | 24.93B USD | 25.09B USD | 21.97B USD |
| Operating expenses | 62.15B USD | 57.47B USD | 54.85B USD | 51.35B USD | 43.89B USD |
| Interest income | — | — | 3.75B USD | 2.83B USD | 2.84B USD |
| Interest expense | — | — | 3.93B USD | 2.93B USD | 2.65B USD |
| Depreciation and amortization | 11.7B USD | 11.45B USD | 11.52B USD | 11.1B USD | 11.28B USD |
| Operating income | 133.05B USD | 123.22B USD | 114.3B USD | 119.44B USD | 108.95B USD |
| Net income | 112.01B USD | 93.74B USD | 97B USD | 99.8B USD | 94.68B USD |
Company facts updated Oct 8, 2026.
Recent quarterly results
Recent quarterly results
Third-party consensus; not a GoAI recommendation.
Average target
$341.68
1.49% upsideCash distributions grouped by calendar year; partial years are marked.
$1.03
2025 complete year+19.1% since 2021
2026 partial: $0.80
$0.865
2,021
$0.91
2,022
$0.95
2,023
$0.99
2,024
$1.03
2,025
$0.80
2,026*
* Partial calendar year in the available dividend history.
| Action | Ex-dividend date | Details | Record date | Payment date |
|---|---|---|---|---|
Dividend | Aug 10, 2026 | $0.27Quarterly | Aug 10, 2026 | Aug 13, 2026 |
Dividend | May 11, 2026 | $0.27Quarterly | May 11, 2026 | May 14, 2026 |
Dividend | Feb 9, 2026 | $0.26Quarterly | Feb 9, 2026 | Feb 12, 2026 |
Dividend | Nov 10, 2025 | $0.26Quarterly | Nov 10, 2025 | Nov 13, 2025 |
Dividend | Aug 11, 2025 | $0.26Quarterly | Aug 11, 2025 | Aug 14, 2025 |
Dividend | May 12, 2025 | $0.26Quarterly | May 12, 2025 | May 15, 2025 |
Ex-dividend Aug 10, 2026
$0.27
Quarterly
Record Aug 10, 2026 · Payment Aug 13, 2026
Ex-dividend May 11, 2026
$0.27
Quarterly
Record May 11, 2026 · Payment May 14, 2026
Ex-dividend Feb 9, 2026
$0.26
Quarterly
Record Feb 9, 2026 · Payment Feb 12, 2026
Ex-dividend Nov 10, 2025
$0.26
Quarterly
Record Nov 10, 2025 · Payment Nov 13, 2025
Ex-dividend Aug 11, 2025
$0.26
Quarterly
Record Aug 11, 2025 · Payment Aug 14, 2025
Ex-dividend May 12, 2025
$0.26
Quarterly
Record May 12, 2025 · Payment May 15, 2025
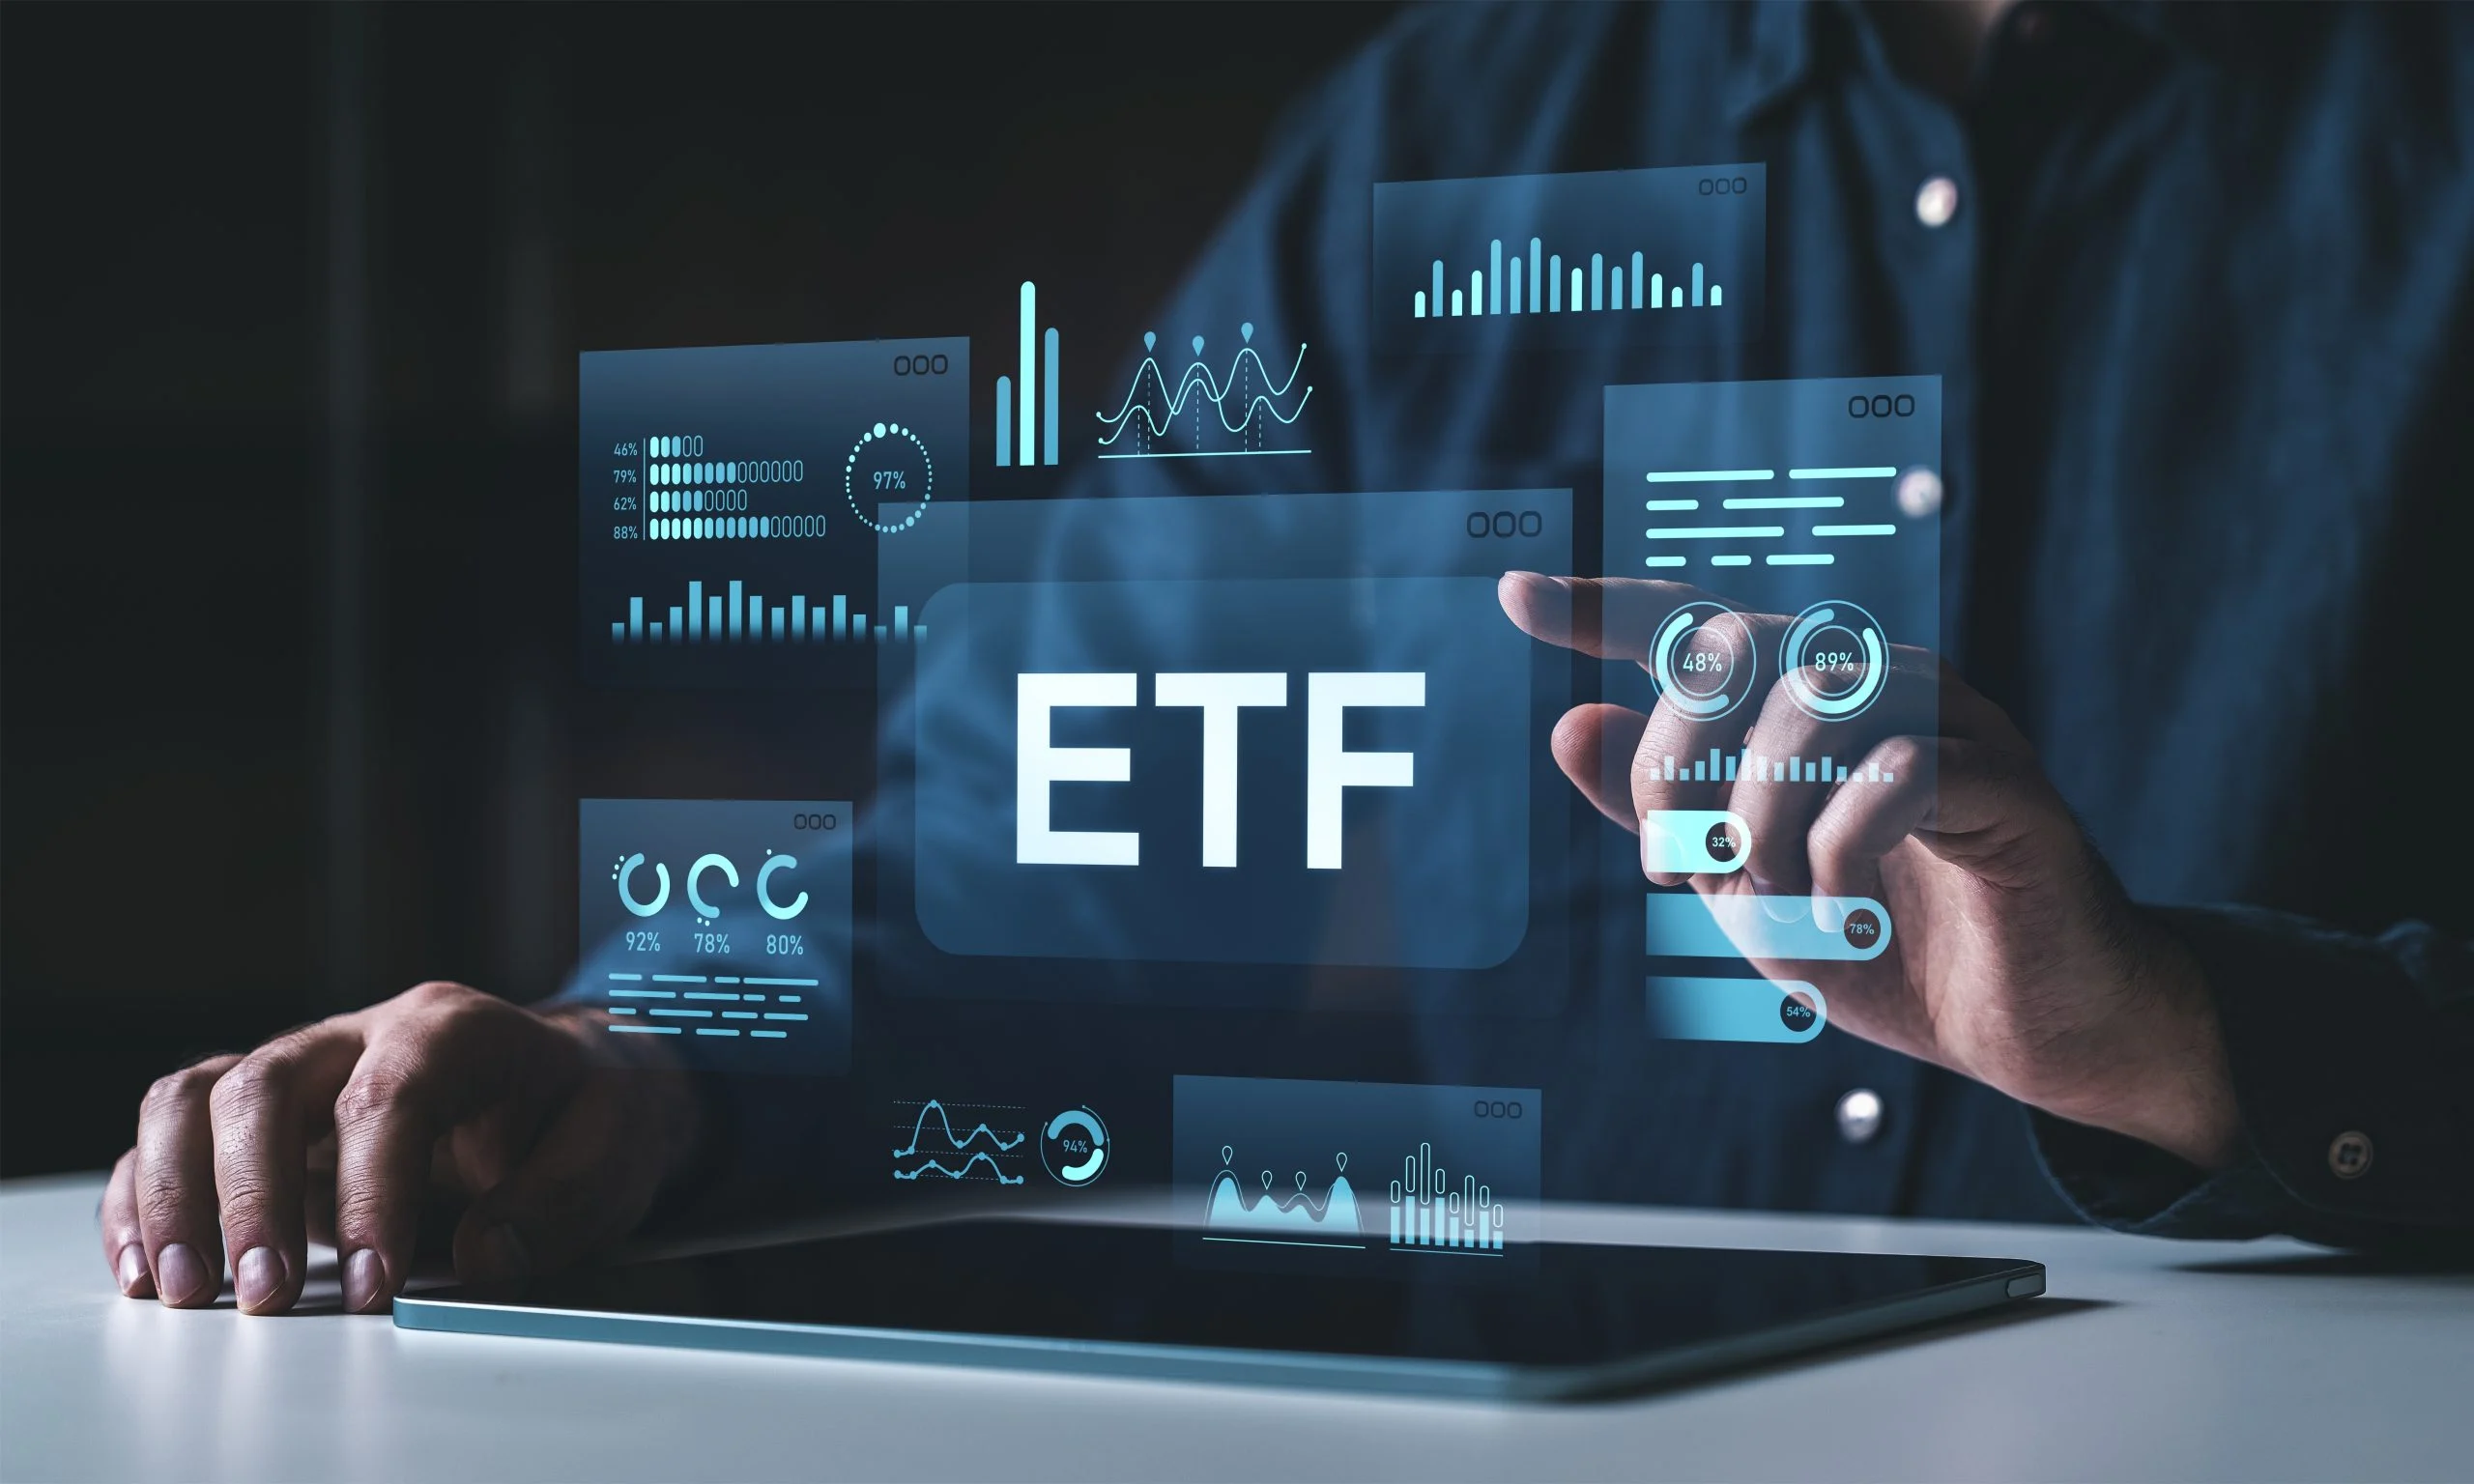
Funds reporting this stock among their holdings, ordered by reported position size.
 State Street SPDR S&P 500 ETF1557.T9.37T7.23%129.41T JPY0.09%¥122,900-0.41%
 Vanguard Morningstar Total Stock Market ETFVTI147.9B6.30%2.3T USD0.03%$381.03-0.40%
 Vanguard S&P 500 ETFVOO123.64B7.03%1.8T USD0.03%$714.34-0.26%
 iShares Core S&P 500 ETFIVV64.87B7.21%899.63B USD0.03%$780.58-0.25%
 State Street SPDR S&P 500 ETFSPY59.15B7.23%819.04B USD0.09%$777.22-0.24%
 Vanguard Morningstar Growth ETFVUG48.05B12.48%384.6B USD0.03%$92.42-0.24%
 Invesco QQQ Trust, Series 1QQQ36.56B7.18%508.48B USD0.18%$757.73-0.25%
 Vanguard Information Technology ETFVGT26.95B15.79%170.2B USD0.09%$129.37-0.33%State Street SPDR S&P 500 ETF1557.TVanguard Morningstar Total Stock Market ETFVTIVanguard S&P 500 ETFVOOiShares Core S&P 500 ETFIVVState Street SPDR S&P 500 ETFSPYVanguard Morningstar Growth ETFVUGInvesco QQQ Trust, Series 1QQQVanguard Information Technology ETFVGT
AI-generated and delayed market data for informational and educational purposes only. Not investment advice.