Loading

NYSEUtilitiesDiversified Utilities
Latest quote
$14.94
+$0.015 · +0.10%
The AES Corporation operates as an international enterprise primarily focused on electricity generation and distribution. Its activities involve both the ownership and management of power plants, producing and supplying electricity to a diverse clientele that includes other utility companies, large industrial consumers, and various intermediate purchasers. Beyond generation, AES also functions as a utility provider, managing infrastructure to either produce or acquire, then transmit, distribute, and ultimately sell power directly to end-users across residential, commercial, industrial, and governmental sectors. The company is also an active participant in the wholesale electricity market. For power production, AES utilizes a broad spectrum of energy sources and advanced technologies. This includes conventional fuels like coal and natural gas, as well as a significant commitment to renewables such as hydroelectric, wind, solar, and biomass. Its renewable portfolio further incorporates energy storage solutions and landfill gas. With an operational generation capacity of approximately 31,459 megawatts, the company maintains a substantial global presence, conducting business in the United States, Puerto Rico, various nations across Central and South America (including El Salvador, Chile, Colombia, Argentina, Brazil, Mexico), the Caribbean, Europe, and Asia. Founded in 1981, the company was initially named Applied Energy Services, Inc., before officially rebranding to The AES Corporation in April 2000. Its corporate headquarters are located in Arlington, Virginia.
Latest quote
$14.94
+$0.015 · +0.10%
After-hours
$14.96
+$0.02 · +0.13%
Oct 9, 7:30 PM ET
Regular session · ET · Market data may be delayed.
The AES Corporation operates as an international enterprise primarily focused on electricity generation and distribution. Its activities involve both the ownership and management of power plants, producing and supplying electricity to a diverse clientele that includes other utility companies, large industrial consumers, and various intermediate purchasers. Beyond generation, AES also functions as a utility provider, managing infrastructure to either produce or acquire, then transmit, distribute, and ultimately sell power directly to end-users across residential, commercial, industrial, and governmental sectors. The company is also an active participant in the wholesale electricity market. For power production, AES utilizes a broad spectrum of energy sources and advanced technologies. This includes conventional fuels like coal and natural gas, as well as a significant commitment to renewables such as hydroelectric, wind, solar, and biomass. Its renewable portfolio further incorporates energy storage solutions and landfill gas. With an operational generation capacity of approximately 31,459 megawatts, the company maintains a substantial global presence, conducting business in the United States, Puerto Rico, various nations across Central and South America (including El Salvador, Chile, Colombia, Argentina, Brazil, Mexico), the Caribbean, Europe, and Asia. Founded in 1981, the company was initially named Applied Energy Services, Inc., before officially rebranding to The AES Corporation in April 2000. Its corporate headquarters are located in Arlington, Virginia.
Day range
Current $14.94
52-week range
Current $14.94
Regular session · ET · Market data may be delayed.
GoAI Score
Buy
Valuation
81
Deep Value
Sentiment
60
Mixed
Risk
16
Low Risk
Momentum
46
Neutral
Full GoAI research
Thesis, catalysts, evidence, and risk analysis.
The AES Corporation operates as an international enterprise primarily focused on electricity generation and distribution. Its activities involve both the ownership and management of power plants, producing and supplying electricity to a diverse clientele that includes other utility companies, large industrial consumers, and various intermediate purchasers. Beyond generation, AES also functions as a utility provider, managing infrastructure to either produce or acquire, then transmit, distribute, and ultimately sell power directly to end-users across residential, commercial, industrial, and governmental sectors. The company is also an active participant in the wholesale electricity market. For power production, AES utilizes a broad spectrum of energy sources and advanced technologies. This includes conventional fuels like coal and natural gas, as well as a significant commitment to renewables such as hydroelectric, wind, solar, and biomass. Its renewable portfolio further incorporates energy storage solutions and landfill gas. With an operational generation capacity of approximately 31,459 megawatts, the company maintains a substantial global presence, conducting business in the United States, Puerto Rico, various nations across Central and South America (including El Salvador, Chile, Colombia, Argentina, Brazil, Mexico), the Caribbean, Europe, and Asia. Founded in 1981, the company was initially named Applied Energy Services, Inc., before officially rebranding to The AES Corporation in April 2000. Its corporate headquarters are located in Arlington, Virginia.
Day range
Current $14.94
52-week range
Current $14.94
Profitability as a percentage of reported revenue.
Revenue
Operating income
Net income
| Metric (USD) | FY2025 | FY2024 | FY2023 | FY2022 | FY2021 |
|---|---|---|---|---|---|
| Revenue | 12.23B USD | 12.28B USD | 12.68B USD | 12.62B USD | 11.14B USD |
| Cost of goods sold | 10.02B USD | 9.96B USD | 10.16B USD | 10.07B USD | 8.43B USD |
| Gross profit | 2.21B USD | 2.32B USD | 2.52B USD | 2.55B USD | 2.71B USD |
| Selling, general, and administrative | 241M USD | 288M USD | 255M USD | 207M USD | 166M USD |
| Operating expenses | 241M USD | 288M USD | 255M USD | 207M USD | 166M USD |
| Interest income | 287M USD | 381M USD | 551M USD | 389M USD | 298M USD |
| Interest expense | 1.42B USD | 1.52B USD | 1.3B USD | 1.06B USD | 826M USD |
| Depreciation and amortization | 1.46B USD | 1.26B USD | 1.13B USD | 1.05B USD | 1.06B USD |
| Operating income | 1.97B USD | 2.03B USD | 2.26B USD | 2.34B USD | 2.55B USD |
| Net income | 949M USD | 1.69B USD | 242M USD | −546M USD | −413M USD |
Company facts updated Oct 10, 2026.
Recent quarterly results
Recent quarterly results
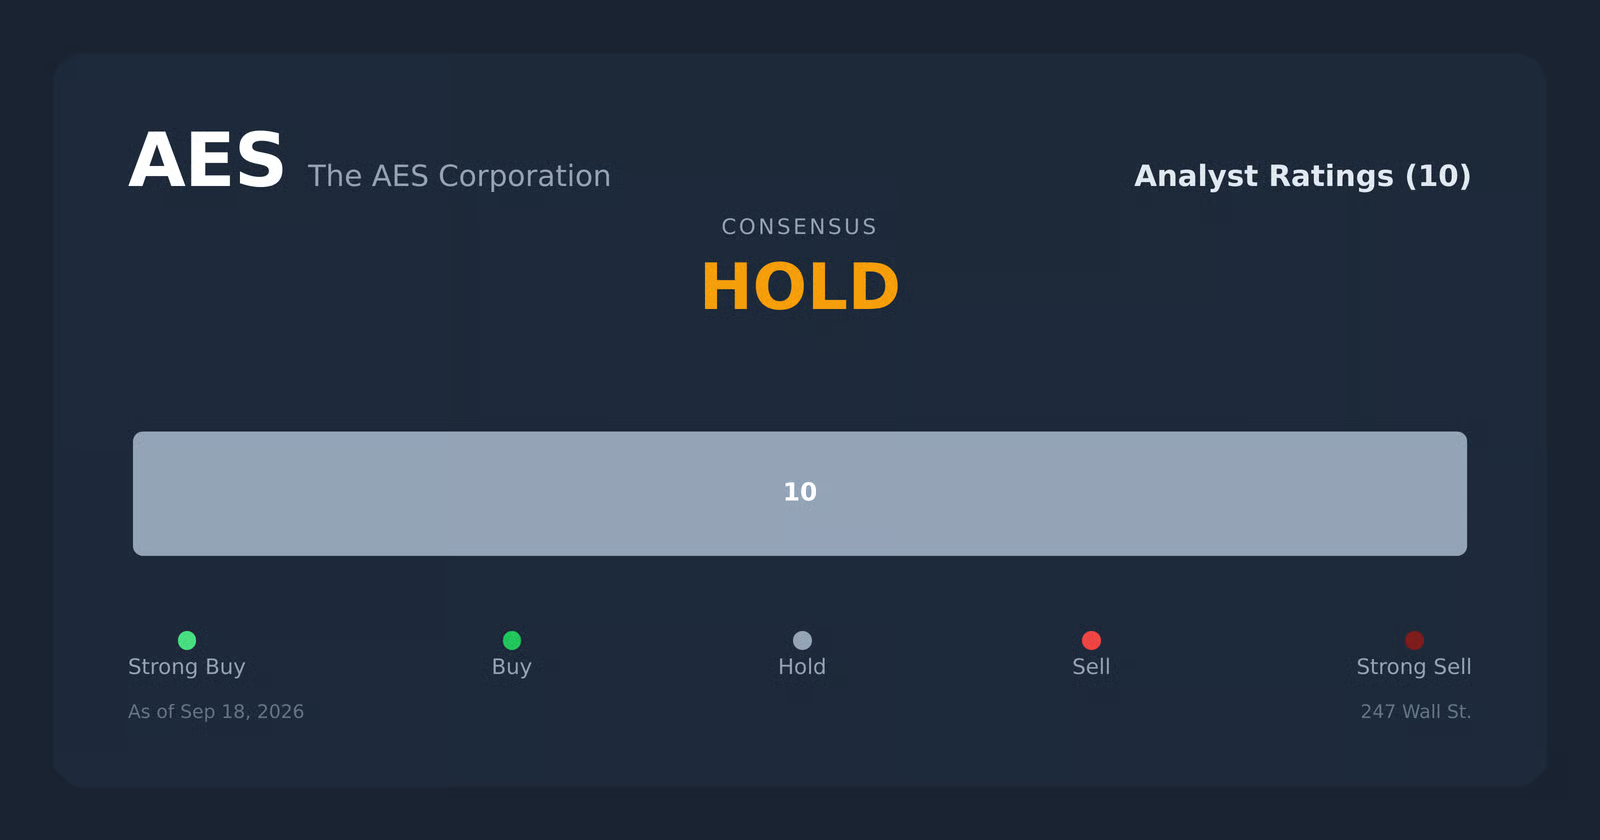
Third-party consensus; not a GoAI recommendation.
Average target
$18.75
25.50% upsideCash distributions grouped by calendar year; partial years are marked.
$0.7038
2025 complete year+16.9% since 2021
2026 partial: $0.5278
$0.602
2,021
$0.632
2,022
$0.6636
2,023
$0.69
2,024
$0.7038
2,025
$0.5278
2,026*
* Partial calendar year in the available dividend history.
| Action | Ex-dividend date | Details | Record date | Payment date |
|---|---|---|---|---|
Dividend | Jul 31, 2026 | $0.176Quarterly | Jul 31, 2026 | Aug 14, 2026 |
Dividend | May 1, 2026 | $0.176Quarterly | May 1, 2026 | May 15, 2026 |
Dividend | Jan 30, 2026 | $0.176Quarterly | Jan 30, 2026 | Feb 13, 2026 |
Dividend | Oct 31, 2025 | $0.176Quarterly | Oct 31, 2025 | Nov 14, 2025 |
Dividend | Aug 1, 2025 | $0.176Quarterly | Aug 1, 2025 | Aug 15, 2025 |
Dividend | May 1, 2025 | $0.176Quarterly | May 1, 2025 | May 15, 2025 |
Ex-dividend Jul 31, 2026
$0.176
Quarterly
Record Jul 31, 2026 · Payment Aug 14, 2026
Ex-dividend May 1, 2026
$0.176
Quarterly
Record May 1, 2026 · Payment May 15, 2026
Ex-dividend Jan 30, 2026
$0.176
Quarterly
Record Jan 30, 2026 · Payment Feb 13, 2026
Ex-dividend Oct 31, 2025
$0.176
Quarterly
Record Oct 31, 2025 · Payment Nov 14, 2025
Ex-dividend Aug 1, 2025
$0.176
Quarterly
Record Aug 1, 2025 · Payment Aug 15, 2025
Ex-dividend May 1, 2025
$0.176
Quarterly
Record May 1, 2025 · Payment May 15, 2025
Funds reporting this stock among their holdings, ordered by reported position size.
 State Street SPDR S&P 500 ETF1557.T20.73B0.02%129.69T JPY0.09%¥122,850+0.12%
 Vanguard Morningstar Total Stock Market ETFVTI333.24M0.01%2.3T USD0.03%$381.94+0.63%
 Vanguard S&P 500 ETFVOO279.28M0.02%1.8T USD0.03%$715.59+0.61%
 Vanguard Morningstar Small-Cap ETFVB241.82M0.13%185.3B USD0.03%$289.48+0.64%
 Invesco S&P 500 Equal Weight ETFRSP196.75M0.20%96.2B USD0.20%$213.04+0.55%
 State Street Utilities Select Sector SPDR ETFXLU194.72M0.82%23.6B USD0.08%$41.41+0.83%
 Vanguard Morningstar Small-Cap Value ETFVBR153.6M0.22%68.2B USD0.05%$234.43+0.22%
 iShares Core S&P 500 ETFIVV141.75M0.02%897.2B USD0.03%$781.97+0.60%State Street SPDR S&P 500 ETF1557.TVanguard Morningstar Total Stock Market ETFVTIVanguard S&P 500 ETFVOOVanguard Morningstar Small-Cap ETFVBInvesco S&P 500 Equal Weight ETFRSPState Street Utilities Select Sector SPDR ETFXLUVanguard Morningstar Small-Cap Value ETFVBRiShares Core S&P 500 ETFIVV
AI-generated and delayed market data for informational and educational purposes only. Not investment advice.