Loading
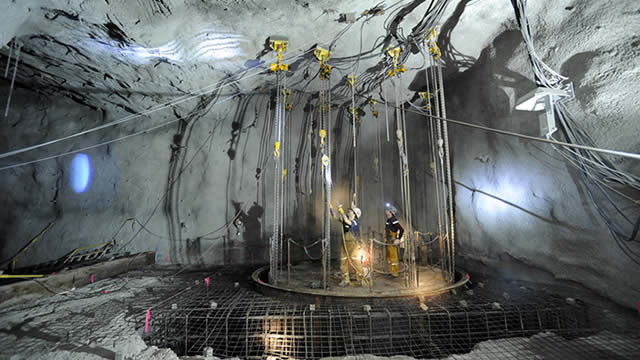
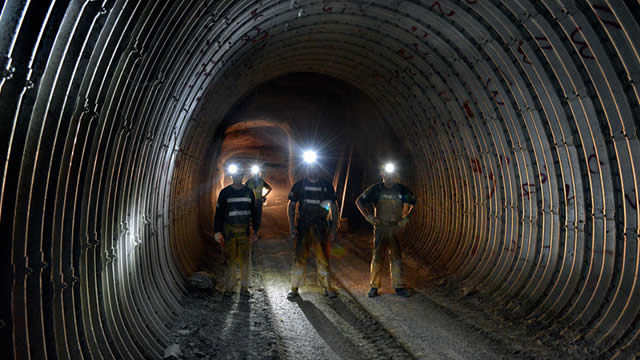
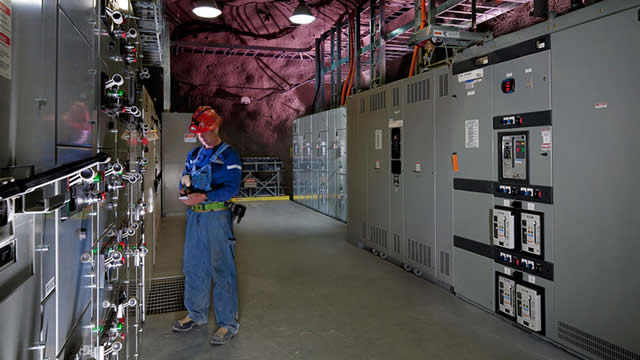
First Majestic Silver Corp. is a North American mining company dedicated to the exploration, acquisition, development, and operation of mineral properties, primarily concentrating on silver and gold output. The company fully owns and operates a portfolio of significant mining assets. In Mexico, these include the San Dimas Silver/Gold Mine (71,868 hectares in Durango and Sinaloa), the Santa Elena Silver/Gold Mine (102,244 hectares in Sonora), the La Encantada Silver Mine (4,076 hectares in Coahuila, complemented by 1,343 hectares of surface rights), the La Parrilla Silver Mine (69,478 hectares in Durango), the Del Toro Silver Mine (comprising 3,815 hectares of mining concessions and 219 hectares of surface rights in Zacatecas), the San Martin Silver Mine (12,795 hectares across 33 mining concessions in Jalisco), and the La Guitarra Silver Mine (39,714 hectares). Beyond Mexico, its holdings extend to the Jerritt Canyon gold mine, spanning approximately 30,821 hectares in Elko County, Nevada. Additionally, First Majestic maintains an interest in the Springpole project, a gold and silver prospect encompassing around 41,913 hectares in Ontario, Canada. Established in 1979, the firm initially operated as First Majestic Resource Corp. before adopting its current name, First Majestic Silver Corp., in November 2006. Its corporate headquarters are located in Vancouver, Canada.
Regular session
$16.70
+$0.05 · +0.30%
Regular session · ET · Market data may be delayed.
First Majestic Silver Corp. is a North American mining company dedicated to the exploration, acquisition, development, and operation of mineral properties, primarily concentrating on silver and gold output. The company fully owns and operates a portfolio of significant mining assets. In Mexico, these include the San Dimas Silver/Gold Mine (71,868 hectares in Durango and Sinaloa), the Santa Elena Silver/Gold Mine (102,244 hectares in Sonora), the La Encantada Silver Mine (4,076 hectares in Coahuila, complemented by 1,343 hectares of surface rights), the La Parrilla Silver Mine (69,478 hectares in Durango), the Del Toro Silver Mine (comprising 3,815 hectares of mining concessions and 219 hectares of surface rights in Zacatecas), the San Martin Silver Mine (12,795 hectares across 33 mining concessions in Jalisco), and the La Guitarra Silver Mine (39,714 hectares). Beyond Mexico, its holdings extend to the Jerritt Canyon gold mine, spanning approximately 30,821 hectares in Elko County, Nevada. Additionally, First Majestic maintains an interest in the Springpole project, a gold and silver prospect encompassing around 41,913 hectares in Ontario, Canada. Established in 1979, the firm initially operated as First Majestic Resource Corp. before adopting its current name, First Majestic Silver Corp., in November 2006. Its corporate headquarters are located in Vancouver, Canada.
Day range
Current $16.70
52-week range
Current $16.70
Regular session · ET · Market data may be delayed.
GoAI Score
Hold
Valuation
78
Undervalued
Sentiment
66
Bullish
Risk
72
High Risk
Momentum
32
Weakening
Full GoAI research
Thesis, catalysts, evidence, and risk analysis.
First Majestic Silver Corp. is a North American mining company dedicated to the exploration, acquisition, development, and operation of mineral properties, primarily concentrating on silver and gold output. The company fully owns and operates a portfolio of significant mining assets. In Mexico, these include the San Dimas Silver/Gold Mine (71,868 hectares in Durango and Sinaloa), the Santa Elena Silver/Gold Mine (102,244 hectares in Sonora), the La Encantada Silver Mine (4,076 hectares in Coahuila, complemented by 1,343 hectares of surface rights), the La Parrilla Silver Mine (69,478 hectares in Durango), the Del Toro Silver Mine (comprising 3,815 hectares of mining concessions and 219 hectares of surface rights in Zacatecas), the San Martin Silver Mine (12,795 hectares across 33 mining concessions in Jalisco), and the La Guitarra Silver Mine (39,714 hectares). Beyond Mexico, its holdings extend to the Jerritt Canyon gold mine, spanning approximately 30,821 hectares in Elko County, Nevada. Additionally, First Majestic maintains an interest in the Springpole project, a gold and silver prospect encompassing around 41,913 hectares in Ontario, Canada. Established in 1979, the firm initially operated as First Majestic Resource Corp. before adopting its current name, First Majestic Silver Corp., in November 2006. Its corporate headquarters are located in Vancouver, Canada.
Day range
Current $16.70
52-week range
Current $16.70
Profitability as a percentage of reported revenue.
Revenue
Operating income
Net income
| Metric (USD) | FY2025 | FY2024 | FY2023 | FY2022 | FY2021 |
|---|---|---|---|---|---|
| Revenue | 1.28B USD | 560.6M USD | 576.39M USD | 626.85M USD | 587.23M USD |
| Cost of goods sold | 833.91M USD | 368.37M USD | 550.74M USD | 610.1M USD | 485.81M USD |
| Gross profit | 445.25M USD | 192.24M USD | 25.64M USD | 16.75M USD | 101.42M USD |
| Selling, general, and administrative | 89.19M USD | 53.09M USD | 50.38M USD | 48.7M USD | 37.68M USD |
| Operating expenses | 89.19M USD | 195.99M USD | 204.43M USD | 55.95M USD | 52.22M USD |
| Interest income | 14.95M USD | 4.99M USD | 3.8M USD | 2.26M USD | 1.07M USD |
| Interest expense | 15.06M USD | 14.7M USD | 15.25M USD | 12.43M USD | 17.04M USD |
| Depreciation and amortization | 280.72M USD | 125.49M USD | 126.17M USD | 137.41M USD | 118.28M USD |
| Operating income | 356.06M USD | −3.76M USD | −178.78M USD | −39.19M USD | 49.2M USD |
| Net income | 167.81M USD | −101.89M USD | −135.11M USD | −114.28M USD | −4.92M USD |
Company facts updated Oct 8, 2026.
Recent quarterly results
Recent quarterly results
Third-party consensus; not a GoAI recommendation.
Average target
$24.75
48.20% upsideCash distributions grouped by calendar year; partial years are marked.
$0.0202
2025 complete year-22.6% since 2022
2026 partial: $0.0406
$0.0261
2,022
$0.0208
2,023
$0.0179
2,024
$0.0202
2,025
$0.0406
2,026*
* Partial calendar year in the available dividend history.
| Action | Ex-dividend date | Details | Record date | Payment date |
|---|---|---|---|---|
Dividend | Aug 14, 2026 | $0.0152Quarterly | Aug 14, 2026 | Aug 31, 2026 |
Dividend | May 20, 2026 | $0.0171Quarterly | May 20, 2026 | May 29, 2026 |
Dividend | Feb 27, 2026 | $0.0083Quarterly | Feb 27, 2026 | Mar 16, 2026 |
Dividend | Nov 14, 2025 | $0.0052Quarterly | Nov 14, 2025 | Nov 28, 2025 |
Dividend | Aug 29, 2025 | $0.0048Quarterly | Aug 29, 2025 | Sep 15, 2025 |
Dividend | May 16, 2025 | $0.0045Quarterly | May 16, 2025 | May 30, 2025 |
Ex-dividend Aug 14, 2026
$0.0152
Quarterly
Record Aug 14, 2026 · Payment Aug 31, 2026
Ex-dividend May 20, 2026
$0.0171
Quarterly
Record May 20, 2026 · Payment May 29, 2026
Ex-dividend Feb 27, 2026
$0.0083
Quarterly
Record Feb 27, 2026 · Payment Mar 16, 2026
Ex-dividend Nov 14, 2025
$0.0052
Quarterly
Record Nov 14, 2025 · Payment Nov 28, 2025
Ex-dividend Aug 29, 2025
$0.0048
Quarterly
Record Aug 29, 2025 · Payment Sep 15, 2025
Ex-dividend May 16, 2025
$0.0045
Quarterly
Record May 16, 2025 · Payment May 30, 2025
Funds reporting this stock among their holdings, ordered by reported position size.
 Amplify Junior Silver Miners ETFSILJ338.93M9.94%3.41B USD0.69%$26.31+0.15%
 VanEck Gold Miners ETFGDX331.67M1.26%25.65B USD0.51%$85.725+0.31%
 VanEck Junior Gold Miners ETFGDXJ194.59M2.32%8.13B USD0.52%$109.66+0.48%
 Sprott Silver Miners & Physical Silver ETFSLVR133.22M19.94%667.94M USD0.65%$52.315-0.08%
 Sprott Critical Materials ETFSETM15.51M3.07%504.37M USD0.65%$28.175-2.24%
 Dimensional - International Core Equity 2 ETFDFIC11.91M0.08%15.01B USD0.22%$37.075-0.71%
 Dimensional - International Small Cap ETFDFIS7.56M0.13%5.74B USD0.39%$35.475-0.96%
 American Beacon GLG Natural Resources ETFMGNR7.38M0.58%1.25B USD0.75%$49.175+0.19%Amplify Junior Silver Miners ETFSILJVanEck Gold Miners ETFGDXVanEck Junior Gold Miners ETFGDXJSprott Silver Miners & Physical Silver ETFSLVRSprott Critical Materials ETFSETMDimensional - International Core Equity 2 ETFDFICDimensional - International Small Cap ETFDFISAmerican Beacon GLG Natural Resources ETFMGNR
AI-generated and delayed market data for informational and educational purposes only. Not investment advice.