Loading

NYSEIndustrialsManufacturing - Textiles
Latest quote
$59.38
+$0.07 · +0.12%
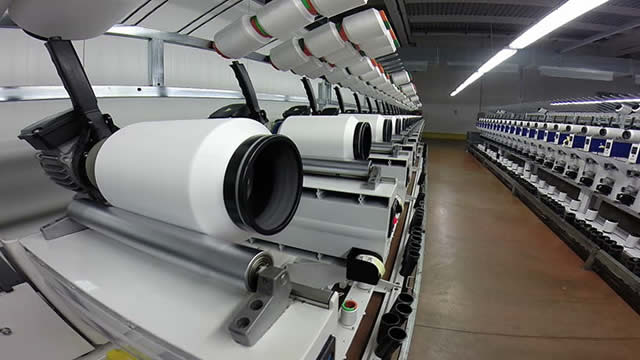
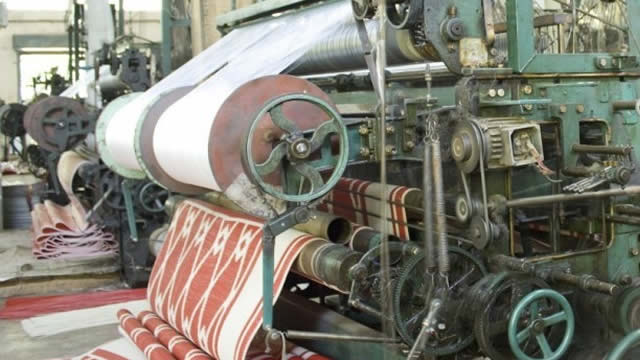
Albany International Corp., along with its various subsidiaries, specializes in the realm of textile and advanced materials processing. The company's operations are distinctly divided into two primary segments: Machine Clothing (MC) and Albany Engineered Composites (AEC). The MC division is responsible for the design, production, and distribution of specialized paper machine clothing, essential for the manufacturing of diverse paper products such as papers, paperboards, tissues, and towels. Beyond this, MC provides a range of technical textiles including forming, pressing, and drying fabrics, alongside process belts. These are crucial components in the production of nonwovens, fiber cement, and a variety of other industrial applications, in addition to offering other engineered fabrics. Conversely, the AEC segment focuses on developing and manufacturing cutting-edge 3D-woven and injected composite components. These advanced materials are specifically utilized in aircraft engines, as well as for airframe and engine parts across both military and commercial aviation platforms. Its global footprint extends across the United States, Switzerland, Brazil, China, France, Mexico, and numerous other international markets. Established in 1895, Albany International Corp. maintains its corporate headquarters in Rochester, New Hampshire.
Previous close
$59.38
+$0.07 · +0.12%
After-hours
$59.38
$0.00 · 0.00%
Oct 7, 5:32 PM ET
Regular session · ET · Market data may be delayed.
Albany International Corp., along with its various subsidiaries, specializes in the realm of textile and advanced materials processing. The company's operations are distinctly divided into two primary segments: Machine Clothing (MC) and Albany Engineered Composites (AEC). The MC division is responsible for the design, production, and distribution of specialized paper machine clothing, essential for the manufacturing of diverse paper products such as papers, paperboards, tissues, and towels. Beyond this, MC provides a range of technical textiles including forming, pressing, and drying fabrics, alongside process belts. These are crucial components in the production of nonwovens, fiber cement, and a variety of other industrial applications, in addition to offering other engineered fabrics. Conversely, the AEC segment focuses on developing and manufacturing cutting-edge 3D-woven and injected composite components. These advanced materials are specifically utilized in aircraft engines, as well as for airframe and engine parts across both military and commercial aviation platforms. Its global footprint extends across the United States, Switzerland, Brazil, China, France, Mexico, and numerous other international markets. Established in 1895, Albany International Corp. maintains its corporate headquarters in Rochester, New Hampshire.
Day range
Current $59.38
52-week range
Current $59.38
Regular session · ET · Market data may be delayed.
GoAI Score
Sell
Valuation
1
Overpriced
Sentiment
57
Mixed
Risk
33
Moderate Risk
Momentum
56
Neutral
Full GoAI research
Thesis, catalysts, evidence, and risk analysis.
Albany International Corp., along with its various subsidiaries, specializes in the realm of textile and advanced materials processing. The company's operations are distinctly divided into two primary segments: Machine Clothing (MC) and Albany Engineered Composites (AEC). The MC division is responsible for the design, production, and distribution of specialized paper machine clothing, essential for the manufacturing of diverse paper products such as papers, paperboards, tissues, and towels. Beyond this, MC provides a range of technical textiles including forming, pressing, and drying fabrics, alongside process belts. These are crucial components in the production of nonwovens, fiber cement, and a variety of other industrial applications, in addition to offering other engineered fabrics. Conversely, the AEC segment focuses on developing and manufacturing cutting-edge 3D-woven and injected composite components. These advanced materials are specifically utilized in aircraft engines, as well as for airframe and engine parts across both military and commercial aviation platforms. Its global footprint extends across the United States, Switzerland, Brazil, China, France, Mexico, and numerous other international markets. Established in 1895, Albany International Corp. maintains its corporate headquarters in Rochester, New Hampshire.
Day range
Current $59.38
52-week range
Current $59.38
Recent quarterly results
Recent quarterly results
Third-party consensus; not a GoAI recommendation.
Average target
$68.00
14.52% upsideFunds reporting this stock among their holdings, ordered by reported position size.
 Gabelli Commercial Aerospace and Defense ETFGCAD277.87M6.55%42.4M USD0.90%$47.63-2.61%
 Avantis U.S. Small Cap Value ETFAVUV82.42M0.27%30.86B USD0.25%$119.13-1.11%
 Vanguard Morningstar Total Stock Market ETFVTI50.29M0.00%2.3T USD0.03%$381.03-0.40%
 iShares Russell 2000 ETFIWM44.77M0.06%78.56B USD0.19%$277.7-1.29%
 Vanguard Morningstar Small-Cap ETFVB36.2M0.02%185.3B USD0.03%$286.98-1.41%
 Vanguard Morningstar Small-Cap Value ETFVBR23M0.03%68.2B USD0.05%$232.17-1.32%
 Vanguard Extended Market ETFVXF18.27M0.02%95.4B USD0.05%$233.49-1.56%
 State Street SPDR Portfolio S&P 600 Small Cap ETFSPSM15.51M0.10%16.01B USD0.03%$53.28-1.32%Gabelli Commercial Aerospace and Defense ETFGCADAvantis U.S. Small Cap Value ETFAVUVVanguard Morningstar Total Stock Market ETFVTIiShares Russell 2000 ETFIWMVanguard Morningstar Small-Cap ETFVBVanguard Morningstar Small-Cap Value ETFVBRVanguard Extended Market ETFVXFState Street SPDR Portfolio S&P 600 Small Cap ETFSPSM
AI-generated and delayed market data for informational and educational purposes only. Not investment advice.