Loading
NASDAQUtilitiesRegulated Water
Latest quote
$33.55
−$0.14 · -0.42%
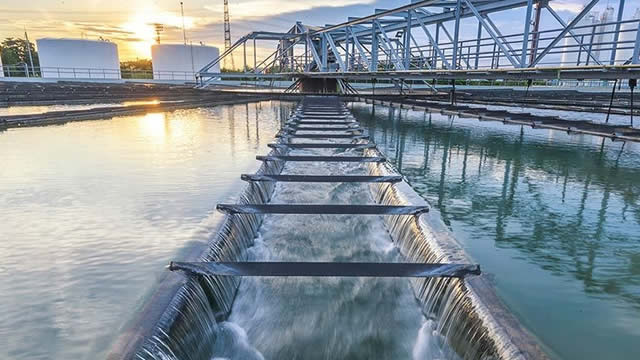
Established in 1905 and headquartered in Newark, Delaware, Artesian Resources Corporation, through its various subsidiaries, delivers water, wastewater, and a range of associated utility services across Delaware, Maryland, and Pennsylvania. The company supplies water for residential, commercial, industrial, governmental, municipal, and utility consumption, along with supporting public and private fire protection, throughout these three states. In Delaware, it provides comprehensive wastewater collection, treatment facilities, and related services. Beyond its primary utility operations, Artesian offers contract water and wastewater services, protective plans for water, sewer, and internal service lines, and comprehensive wastewater management. Its capabilities also encompass design, construction, and engineering services within the utility sector. Furthermore, it extends support to other water utilities by managing their operations and billing. The corporation holds various real estate assets, such as land for its offices and for water and wastewater treatment facilities, and its portfolio also includes the design, installation, maintenance, and repair of stormwater management systems. By December 31, 2021, Artesian's extensive network, comprising 1,368 miles of transmission and distribution mains, served approximately 91,700 customers in Delaware, 2,500 in Maryland, and 40 in Pennsylvania.
Previous close
$33.55
−$0.14 · -0.42%
After-hours
$33.55
$0.00 · 0.00%
Oct 7, 7:30 PM ET
Regular session · ET · Market data may be delayed.
Established in 1905 and headquartered in Newark, Delaware, Artesian Resources Corporation, through its various subsidiaries, delivers water, wastewater, and a range of associated utility services across Delaware, Maryland, and Pennsylvania. The company supplies water for residential, commercial, industrial, governmental, municipal, and utility consumption, along with supporting public and private fire protection, throughout these three states. In Delaware, it provides comprehensive wastewater collection, treatment facilities, and related services. Beyond its primary utility operations, Artesian offers contract water and wastewater services, protective plans for water, sewer, and internal service lines, and comprehensive wastewater management. Its capabilities also encompass design, construction, and engineering services within the utility sector. Furthermore, it extends support to other water utilities by managing their operations and billing. The corporation holds various real estate assets, such as land for its offices and for water and wastewater treatment facilities, and its portfolio also includes the design, installation, maintenance, and repair of stormwater management systems. By December 31, 2021, Artesian's extensive network, comprising 1,368 miles of transmission and distribution mains, served approximately 91,700 customers in Delaware, 2,500 in Maryland, and 40 in Pennsylvania.
Day range
Current $33.55
52-week range
Current $33.55
Regular session · ET · Market data may be delayed.
GoAI Score
Buy
Valuation
78
Undervalued
Sentiment
69
Bullish
Risk
15
Low Risk
Momentum
49
Neutral
Full GoAI research
Thesis, catalysts, evidence, and risk analysis.
Established in 1905 and headquartered in Newark, Delaware, Artesian Resources Corporation, through its various subsidiaries, delivers water, wastewater, and a range of associated utility services across Delaware, Maryland, and Pennsylvania. The company supplies water for residential, commercial, industrial, governmental, municipal, and utility consumption, along with supporting public and private fire protection, throughout these three states. In Delaware, it provides comprehensive wastewater collection, treatment facilities, and related services. Beyond its primary utility operations, Artesian offers contract water and wastewater services, protective plans for water, sewer, and internal service lines, and comprehensive wastewater management. Its capabilities also encompass design, construction, and engineering services within the utility sector. Furthermore, it extends support to other water utilities by managing their operations and billing. The corporation holds various real estate assets, such as land for its offices and for water and wastewater treatment facilities, and its portfolio also includes the design, installation, maintenance, and repair of stormwater management systems. By December 31, 2021, Artesian's extensive network, comprising 1,368 miles of transmission and distribution mains, served approximately 91,700 customers in Delaware, 2,500 in Maryland, and 40 in Pennsylvania.
Day range
Current $33.55
52-week range
Current $33.55
Recent quarterly results
Recent quarterly results
Funds reporting this stock among their holdings, ordered by reported position size.
 Vanguard Morningstar Total Stock Market ETFVTI9.9M0.00%2.3T USD0.03%$381.03-0.40%
 Vanguard Extended Market ETFVXF3.97M0.00%95.4B USD0.05%$233.49-1.56%
 Dimensional - US Small Cap ETFDFAS3.04M0.01%34.14B USD0.31%$77.92-1.38%
 Vanguard Utilities ETFVPU2.2M0.02%10.1B USD0.09%$178.17-0.01%
 WisdomTree U.S. SmallCap Dividend FundDES1.61M0.08%2.08B USD0.38%$38.24-1.06%
 U.S. Micro Cap Portfolio ETFDFMC1.13M0.01%7.62B USD0.43%$57.50-1.29%
 iShares Core S&P Total U.S. Stock Market ETFITOT632.5K0.00%98.16B USD0.03%$169.28-0.37%
 Dimensional - US Core Equity 2 ETFDFAC621.41K0.00%88.77B USD0.21%$45.18-0.57%Vanguard Morningstar Total Stock Market ETFVTIVanguard Extended Market ETFVXFDimensional - US Small Cap ETFDFASVanguard Utilities ETFVPUWisdomTree U.S. SmallCap Dividend FundDESU.S. Micro Cap Portfolio ETFDFMCiShares Core S&P Total U.S. Stock Market ETFITOTDimensional - US Core Equity 2 ETFDFAC
AI-generated and delayed market data for informational and educational purposes only. Not investment advice.