Loading

NYSEIndustrialsManufacturing - Metal Fabrication
Latest quote
$188.13
−$1.06 · -0.56%
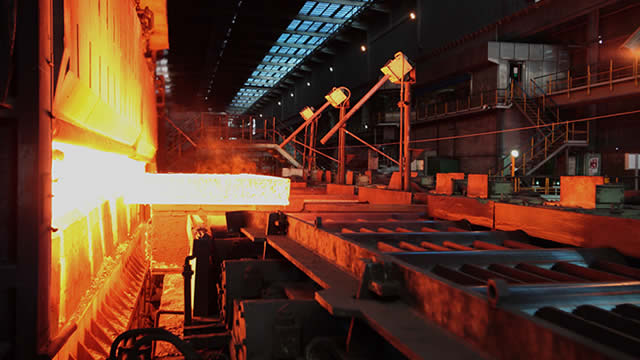
Globally, ATI Inc. stands as a premier manufacturer and supplier of specialized materials and complex components. The enterprise's operations are strategically divided into two primary divisions: High Performance Materials & Components (HPMC) and Advanced Alloys & Solutions (AA&S). The HPMC segment is responsible for creating a diverse range of advanced substances, including titanium and its numerous alloys, nickel- and cobalt-based alloys (such as superalloys), sophisticated powdered alloys, and other distinctive specialty materials. These are offered in elongated product forms like ingots, billets, bars, rods, wires, various structural shapes, rectangular sections, and seamless tubing. Additionally, this division engineers precision forgings, finished components, and custom-machined parts, primarily catering to the aerospace, defense, medical, and energy industries. In contrast, the AA&S segment focuses on producing zirconium and its associated alloys, which include hafnium and niobium, alongside nickel-based alloys, titanium and its specific alloys, and other unique high-performance alloys. These are commonly supplied as plates, sheets, and meticulously rolled strip products. This segment further extends its services to include hot-rolling conversion for materials like carbon steel and titanium products. The offerings from AA&S find critical applications across the energy, aerospace and defense, automotive, and electronics sectors. Formerly known as Allegheny Technologies Incorporated, ATI Inc. was established in 1960 and currently maintains its corporate headquarters in Dallas, Texas.
Previous close
$188.13
−$1.06 · -0.56%
Pre-market
$189
+$0.87 · +0.46%
Oct 9, 7:14 AM ET
Regular session · ET · Market data may be delayed.
Globally, ATI Inc. stands as a premier manufacturer and supplier of specialized materials and complex components. The enterprise's operations are strategically divided into two primary divisions: High Performance Materials & Components (HPMC) and Advanced Alloys & Solutions (AA&S). The HPMC segment is responsible for creating a diverse range of advanced substances, including titanium and its numerous alloys, nickel- and cobalt-based alloys (such as superalloys), sophisticated powdered alloys, and other distinctive specialty materials. These are offered in elongated product forms like ingots, billets, bars, rods, wires, various structural shapes, rectangular sections, and seamless tubing. Additionally, this division engineers precision forgings, finished components, and custom-machined parts, primarily catering to the aerospace, defense, medical, and energy industries. In contrast, the AA&S segment focuses on producing zirconium and its associated alloys, which include hafnium and niobium, alongside nickel-based alloys, titanium and its specific alloys, and other unique high-performance alloys. These are commonly supplied as plates, sheets, and meticulously rolled strip products. This segment further extends its services to include hot-rolling conversion for materials like carbon steel and titanium products. The offerings from AA&S find critical applications across the energy, aerospace and defense, automotive, and electronics sectors. Formerly known as Allegheny Technologies Incorporated, ATI Inc. was established in 1960 and currently maintains its corporate headquarters in Dallas, Texas.
Day range
Current $188.13
52-week range
Current $188.13
Regular session · ET · Market data may be delayed.
GoAI Score
Hold
Valuation
24
Expensive
Sentiment
55
Mixed
Risk
32
Moderate Risk
Momentum
53
Neutral
Full GoAI research
Thesis, catalysts, evidence, and risk analysis.
Globally, ATI Inc. stands as a premier manufacturer and supplier of specialized materials and complex components. The enterprise's operations are strategically divided into two primary divisions: High Performance Materials & Components (HPMC) and Advanced Alloys & Solutions (AA&S). The HPMC segment is responsible for creating a diverse range of advanced substances, including titanium and its numerous alloys, nickel- and cobalt-based alloys (such as superalloys), sophisticated powdered alloys, and other distinctive specialty materials. These are offered in elongated product forms like ingots, billets, bars, rods, wires, various structural shapes, rectangular sections, and seamless tubing. Additionally, this division engineers precision forgings, finished components, and custom-machined parts, primarily catering to the aerospace, defense, medical, and energy industries. In contrast, the AA&S segment focuses on producing zirconium and its associated alloys, which include hafnium and niobium, alongside nickel-based alloys, titanium and its specific alloys, and other unique high-performance alloys. These are commonly supplied as plates, sheets, and meticulously rolled strip products. This segment further extends its services to include hot-rolling conversion for materials like carbon steel and titanium products. The offerings from AA&S find critical applications across the energy, aerospace and defense, automotive, and electronics sectors. Formerly known as Allegheny Technologies Incorporated, ATI Inc. was established in 1960 and currently maintains its corporate headquarters in Dallas, Texas.
Day range
Current $188.13
52-week range
Current $188.13
Profitability as a percentage of reported revenue.
Revenue
Operating income
Net income
| Metric (USD) | FY2025 | FY2024 | FY2023 | FY2022 | FY2021 |
|---|---|---|---|---|---|
| Revenue | 4.59B USD | 4.36B USD | 4.17B USD | 3.84B USD | 2.8B USD |
| Cost of goods sold | 3.59B USD | 3.45B USD | 3.35B USD | 3.12B USD | 2.47B USD |
| Gross profit | 999.8M USD | 913.5M USD | 826.3M USD | 714.2M USD | 334M USD |
| Research and development | 21.3M USD | 22.1M USD | 22.1M USD | 17.7M USD | 20M USD |
| Selling, general, and administrative | 343.8M USD | 368.6M USD | 407.8M USD | 159.1M USD | 33.1M USD |
| Operating expenses | 365.1M USD | 304.6M USD | 359.9M USD | 398.1M USD | 216.4M USD |
| Interest income | 12.1M USD | 16M USD | 13M USD | 4.7M USD | — |
| Interest expense | 110.7M USD | 124.2M USD | 105.8M USD | 92.1M USD | 96.9M USD |
| Depreciation and amortization | 168.1M USD | 151.5M USD | 146.1M USD | 142.9M USD | 143.9M USD |
| Operating income | 634.7M USD | 608.9M USD | 466.4M USD | 316.1M USD | 117.6M USD |
| Net income | 404.3M USD | 367.8M USD | 410.8M USD | 323.5M USD | 184.6M USD |
Company facts updated Oct 9, 2026.
Recent quarterly results
Recent quarterly results
Third-party consensus; not a GoAI recommendation.
Average target
$242
28.63% upsideCash distributions grouped by calendar year; partial years are marked.
$0.62
2015 complete year-13.9% since 2011
$0.72
2,011
$0.72
2,012
$0.72
2,013
$0.72
2,014
$0.62
2,015
| Action | Ex-dividend date | Details | Record date | Payment date |
|---|---|---|---|---|
Dividend | Aug 16, 2016 | $0.08Quarterly | Aug 18, 2016 | Sep 8, 2016 |
Dividend | May 25, 2016 | $0.08Quarterly | May 27, 2016 | Jun 9, 2016 |
Dividend | Mar 9, 2016 | $0.08Quarterly | Mar 11, 2016 | Mar 24, 2016 |
Dividend | Dec 17, 2015 | $0.08Quarterly | Dec 21, 2015 | Dec 30, 2015 |
Dividend | Aug 17, 2015 | $0.18Quarterly | Aug 19, 2015 | Sep 16, 2015 |
Dividend | May 22, 2015 | $0.18Quarterly | May 27, 2015 | Jun 17, 2015 |
Ex-dividend Aug 16, 2016
$0.08
Quarterly
Record Aug 18, 2016 · Payment Sep 8, 2016
Ex-dividend May 25, 2016
$0.08
Quarterly
Record May 27, 2016 · Payment Jun 9, 2016
Ex-dividend Mar 9, 2016
$0.08
Quarterly
Record Mar 11, 2016 · Payment Mar 24, 2016
Ex-dividend Dec 17, 2015
$0.08
Quarterly
Record Dec 21, 2015 · Payment Dec 30, 2015
Ex-dividend Aug 17, 2015
$0.18
Quarterly
Record Aug 19, 2015 · Payment Sep 16, 2015
Ex-dividend May 22, 2015
$0.18
Quarterly
Record May 27, 2015 · Payment Jun 17, 2015
Funds reporting this stock among their holdings, ordered by reported position size.
 Vanguard Morningstar Total Stock Market ETFVTI885.23M0.04%2.3T USD0.03%$379.56-0.39%
 Vanguard Morningstar Small-Cap ETFVB641.24M0.34%185.3B USD0.03%$287.63+0.23%
 Vanguard Morningstar Small-Cap Growth ETFVBK367.99M0.80%44.7B USD0.05%$340.59-0.48%
 Vanguard Extended Market ETFVXF323.73M0.33%95.4B USD0.05%$233.13-0.15%
 iShares Large Cap Core Active ETFBLCR289.71M2.97%9.73B USD0.38%$49.86-0.76%
 Invesco S&P MidCap Momentum ETFXMMO279.92M3.95%7.08B USD0.34%$147.38-0.63%
 iShares U.S. Aerospace & Defense ETFITA240.97M2.04%11.87B USD0.37%$204.88+0.63%
 Global X - U.S. Infrastructure Development ETFPAVE218.96M1.57%13.6B USD0.47%$53.25-0.08%Vanguard Morningstar Total Stock Market ETFVTIVanguard Morningstar Small-Cap ETFVBVanguard Morningstar Small-Cap Growth ETFVBKVanguard Extended Market ETFVXFiShares Large Cap Core Active ETFBLCRInvesco S&P MidCap Momentum ETFXMMOiShares U.S. Aerospace & Defense ETFITAGlobal X - U.S. Infrastructure Development ETFPAVE
AI-generated and delayed market data for informational and educational purposes only. Not investment advice.