Loading

NYSEUtilitiesDiversified Utilities
Latest quote
$37.10
+$0.21 · +0.57%
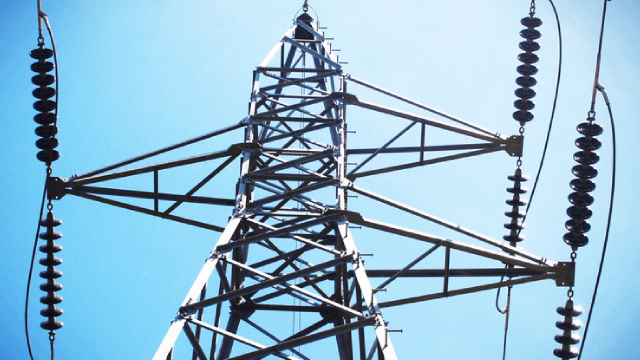
Brookfield Infrastructure Partners L.P. (BIP) possesses and operates a varied portfolio of essential infrastructure assets. These investments span utilities, transportation networks, midstream energy infrastructure, and digital data platforms across key global regions, specifically North and South America, Europe, and the Asia Pacific. Within its Utilities division, BIP manages an expansive network. This includes roughly 61,000 kilometers of active electricity transmission and distribution lines, augmented by another 5,300 kilometers dedicated solely to electricity transmission. The segment also oversees 4,200 kilometers of natural gas pipelines, providing service to 7.3 million electricity and natural gas connections. Additionally, it administers 360,000 long-term contracted sub-metering services. Complementary offerings extend to heating and cooling solutions, natural gas distribution, water heater provisions, and rental services for heating, ventilation, and air conditioning systems, along with other home-related amenities. The Transport segment is dedicated to facilitating the movement, storage, and handling of goods (merchandise and commodities) as well as passengers. Its substantial infrastructure comprises approximately: 22,000 km of track An additional 5,500 km of track network 4,800 km of railway lines 3,800 km of motorways 13 port terminals BIP's Midstream division specializes in natural gas services, encompassing transmission, gathering, processing, and storage. Its assets in this area consist of: Approximately 15,000 km of natural gas transmission pipelines A natural gas storage capacity of 600 billion cubic feet 17 natural gas processing facilities 3,900 km of gas gathering pipelines A single petrochemical processing complex The Data segment maintains a comprehensive digital infrastructure footprint. This includes: Around 148,000 operational telecommunication towers 8,000 multi-purpose towers and active rooftop sites 10,000 km of primary fiber backbone 1,600 cell sites Approximately 12,000 km of fiber optic cabling 2,100 active telecommunication towers 70 distributed antenna systems (DAS) 50 data centers with a collective critical load capacity of 200 megawatts. Established in 2007, Brookfield Infrastructure Partners L.P. has its headquarters in Hamilton, Bermuda. The entity functions as a subsidiary of Brookfield Asset Management Inc.
Latest quote
$37.10
+$0.21 · +0.57%
Regular session · ET · Market data may be delayed.
Brookfield Infrastructure Partners L.P. (BIP) possesses and operates a varied portfolio of essential infrastructure assets. These investments span utilities, transportation networks, midstream energy infrastructure, and digital data platforms across key global regions, specifically North and South America, Europe, and the Asia Pacific. Within its Utilities division, BIP manages an expansive network. This includes roughly 61,000 kilometers of active electricity transmission and distribution lines, augmented by another 5,300 kilometers dedicated solely to electricity transmission. The segment also oversees 4,200 kilometers of natural gas pipelines, providing service to 7.3 million electricity and natural gas connections. Additionally, it administers 360,000 long-term contracted sub-metering services. Complementary offerings extend to heating and cooling solutions, natural gas distribution, water heater provisions, and rental services for heating, ventilation, and air conditioning systems, along with other home-related amenities. The Transport segment is dedicated to facilitating the movement, storage, and handling of goods (merchandise and commodities) as well as passengers. Its substantial infrastructure comprises approximately: 22,000 km of track An additional 5,500 km of track network 4,800 km of railway lines 3,800 km of motorways 13 port terminals BIP's Midstream division specializes in natural gas services, encompassing transmission, gathering, processing, and storage. Its assets in this area consist of: Approximately 15,000 km of natural gas transmission pipelines A natural gas storage capacity of 600 billion cubic feet 17 natural gas processing facilities 3,900 km of gas gathering pipelines A single petrochemical processing complex The Data segment maintains a comprehensive digital infrastructure footprint. This includes: Around 148,000 operational telecommunication towers 8,000 multi-purpose towers and active rooftop sites 10,000 km of primary fiber backbone 1,600 cell sites Approximately 12,000 km of fiber optic cabling 2,100 active telecommunication towers 70 distributed antenna systems (DAS) 50 data centers with a collective critical load capacity of 200 megawatts. Established in 2007, Brookfield Infrastructure Partners L.P. has its headquarters in Hamilton, Bermuda. The entity functions as a subsidiary of Brookfield Asset Management Inc.
Regular session · ET · Market data may be delayed.
GoAI Score
Hold
Valuation
61
Undervalued
Sentiment
53
Mixed
Risk
23
Moderate Risk
Momentum
45
Neutral
Full GoAI research
Thesis, catalysts, evidence, and risk analysis.
Brookfield Infrastructure Partners L.P. (BIP) possesses and operates a varied portfolio of essential infrastructure assets. These investments span utilities, transportation networks, midstream energy infrastructure, and digital data platforms across key global regions, specifically North and South America, Europe, and the Asia Pacific. Within its Utilities division, BIP manages an expansive network. This includes roughly 61,000 kilometers of active electricity transmission and distribution lines, augmented by another 5,300 kilometers dedicated solely to electricity transmission. The segment also oversees 4,200 kilometers of natural gas pipelines, providing service to 7.3 million electricity and natural gas connections. Additionally, it administers 360,000 long-term contracted sub-metering services. Complementary offerings extend to heating and cooling solutions, natural gas distribution, water heater provisions, and rental services for heating, ventilation, and air conditioning systems, along with other home-related amenities. The Transport segment is dedicated to facilitating the movement, storage, and handling of goods (merchandise and commodities) as well as passengers. Its substantial infrastructure comprises approximately: 22,000 km of track An additional 5,500 km of track network 4,800 km of railway lines 3,800 km of motorways 13 port terminals BIP's Midstream division specializes in natural gas services, encompassing transmission, gathering, processing, and storage. Its assets in this area consist of: Approximately 15,000 km of natural gas transmission pipelines A natural gas storage capacity of 600 billion cubic feet 17 natural gas processing facilities 3,900 km of gas gathering pipelines A single petrochemical processing complex The Data segment maintains a comprehensive digital infrastructure footprint. This includes: Around 148,000 operational telecommunication towers 8,000 multi-purpose towers and active rooftop sites 10,000 km of primary fiber backbone 1,600 cell sites Approximately 12,000 km of fiber optic cabling 2,100 active telecommunication towers 70 distributed antenna systems (DAS) 50 data centers with a collective critical load capacity of 200 megawatts. Established in 2007, Brookfield Infrastructure Partners L.P. has its headquarters in Hamilton, Bermuda. The entity functions as a subsidiary of Brookfield Asset Management Inc.
Profitability as a percentage of reported revenue.
Revenue
Operating income
Net income
| Metric (USD) | FY2025 | FY2024 | FY2023 | FY2022 | FY2021 |
|---|---|---|---|---|---|
| Revenue | 23.1B USD | 21.04B USD | 17.93B USD | 14.43B USD | 11.54B USD |
| Cost of goods sold | 16.88B USD | 15.68B USD | 13.47B USD | 10.51B USD | 8.25B USD |
| Gross profit | 6.22B USD | 5.36B USD | 4.46B USD | 3.92B USD | 3.29B USD |
| Selling, general, and administrative | 426M USD | 405M USD | 413M USD | 433M USD | 406M USD |
| Operating expenses | 426M USD | 405M USD | 413M USD | 433M USD | 406M USD |
| Interest expense | 3.87B USD | 3.04B USD | 2.5B USD | 1.6B USD | 1.24B USD |
| Depreciation and amortization | 4.02B USD | 3.64B USD | 2.74B USD | 2.16B USD | 2.04B USD |
| Operating income | 5.8B USD | 4.96B USD | 4.05B USD | 3.48B USD | 2.88B USD |
| Net income | 449M USD | 351M USD | 367M USD | 341M USD | 766M USD |
Company facts updated Oct 9, 2026.
Reported history and fiscal-year consensus
Reported history and fiscal-year consensus
Third-party consensus; not a GoAI recommendation.
Average target
$48.50
30.73% upsideFunds reporting this stock among their holdings, ordered by reported position size.
 Invesco International Dividend Achievers ETFPID23.48M2.74%848.44M USD0.53%$21.7117+0.10%
 Inspire Fidelis Multi Factor ETFFDLS2.6M1.04%249.66M USD0.66%$42.23+0.67%
 ProShares - DJ Brookfield Global Infrastructure ETFTOLZ746.43K0.46%160.96M USD0.46%$56.14+0.79%
 Invesco Dividend Achievers ETFPFM480.93K0.06%778.03M USD0.52%$56.16+0.54%
 Virtus Real Asset Income ETFVRAI205.66K1.15%17.84M USD0.55%$27.50+0.25%
 ProShares - Supply Chain Logistics ETFSUPL64.19K2.91%2.21M USD0.58%$44.7978+0.79%
 Guinness Atkinson Real Assets Income ETFGARA11.66K2.85%400K USD0.50%$25.3350.00%Invesco International Dividend Achievers ETFPIDInspire Fidelis Multi Factor ETFFDLSProShares - DJ Brookfield Global Infrastructure ETFTOLZInvesco Dividend Achievers ETFPFMVirtus Real Asset Income ETFVRAIProShares - Supply Chain Logistics ETFSUPLGuinness Atkinson Real Assets Income ETFGARA
AI-generated and delayed market data for informational and educational purposes only. Not investment advice.