Loading

NASDAQIndustrialsElectrical Equipment & Parts
Latest quote
$2.00
−$0.06 · -2.91%
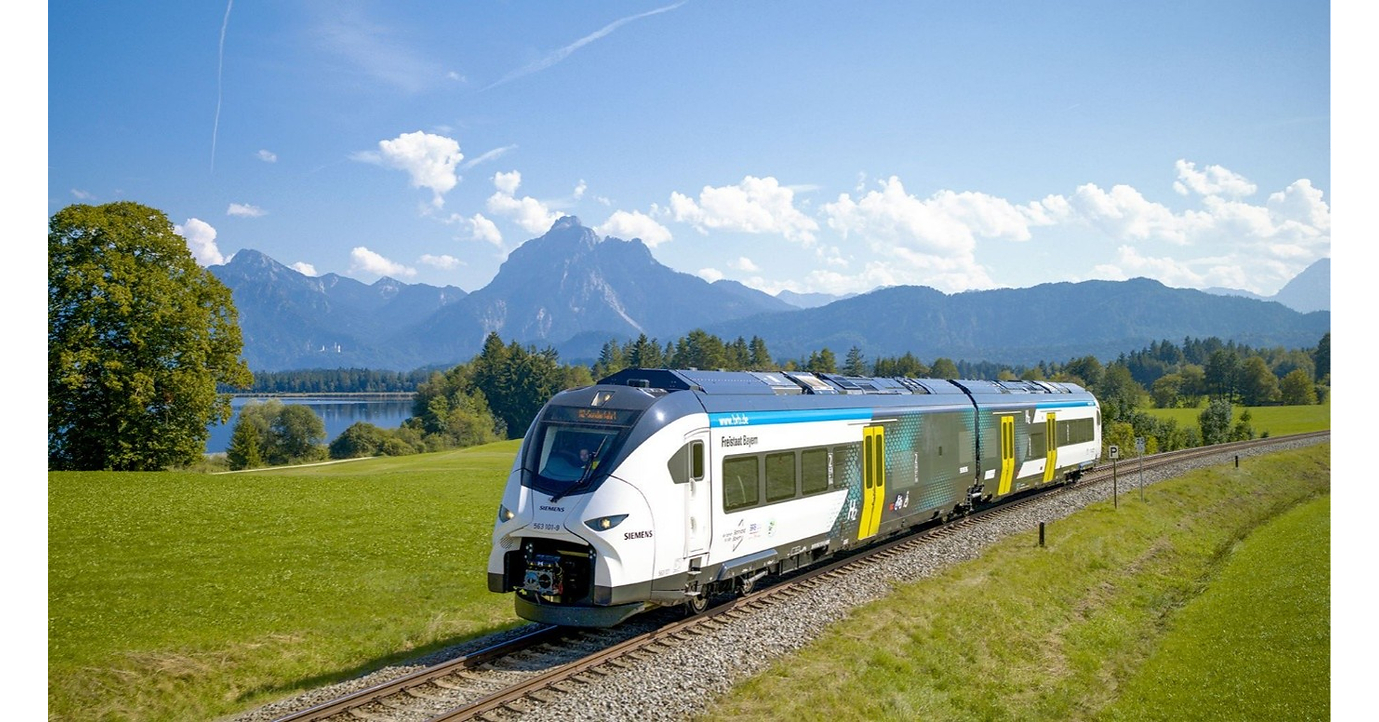
Ballard Power Systems Inc. specializes in the full lifecycle of proton exchange membrane (PEM) fuel cell technology, encompassing research, production, sales, and ongoing support. Their fuel cell offerings cater to various power applications, including heavy-duty transportation sectors like buses, trucks, trains, and marine vessels, as well as solutions for material handling equipment and critical backup power systems. Beyond products, Ballard extends its expertise through technology solutions, providing engineering services, technology transfer, and licensing its extensive intellectual property and core knowledge for diverse PEM fuel cell uses. They also deliver integrated hydrogen fuel cell powertrain and vehicle systems. The company maintains a broad international presence, with operations spanning numerous countries including China, Germany, the United States, the United Kingdom, Canada, Denmark, Norway, Belgium, Japan, France, Spain, Taiwan, Poland, India, Ukraine, and Sweden. A significant strategic partnership exists with Linamar Corporation, focused on jointly developing and marketing fuel cell powertrains and components designed for Class 1 and 2 vehicles across North America and Europe. Established in 1979, Ballard Power Systems Inc. is headquartered in Burnaby, Canada.
Previous close
$2.00
−$0.06 · -2.91%
After-hours
$2.00
$0.00 · 0.00%
Oct 7, 7:30 PM ET
Regular session · ET · Market data may be delayed.
Ballard Power Systems Inc. specializes in the full lifecycle of proton exchange membrane (PEM) fuel cell technology, encompassing research, production, sales, and ongoing support. Their fuel cell offerings cater to various power applications, including heavy-duty transportation sectors like buses, trucks, trains, and marine vessels, as well as solutions for material handling equipment and critical backup power systems. Beyond products, Ballard extends its expertise through technology solutions, providing engineering services, technology transfer, and licensing its extensive intellectual property and core knowledge for diverse PEM fuel cell uses. They also deliver integrated hydrogen fuel cell powertrain and vehicle systems. The company maintains a broad international presence, with operations spanning numerous countries including China, Germany, the United States, the United Kingdom, Canada, Denmark, Norway, Belgium, Japan, France, Spain, Taiwan, Poland, India, Ukraine, and Sweden. A significant strategic partnership exists with Linamar Corporation, focused on jointly developing and marketing fuel cell powertrains and components designed for Class 1 and 2 vehicles across North America and Europe. Established in 1979, Ballard Power Systems Inc. is headquartered in Burnaby, Canada.
Day range
Current $2.00
52-week range
Current $2.00
Regular session · ET · Market data may be delayed.
GoAI Score
Hold
Valuation
70
Undervalued
Sentiment
61
Bullish
Risk
74
High Risk
Momentum
32
Weakening
Full GoAI research
Thesis, catalysts, evidence, and risk analysis.
Ballard Power Systems Inc. specializes in the full lifecycle of proton exchange membrane (PEM) fuel cell technology, encompassing research, production, sales, and ongoing support. Their fuel cell offerings cater to various power applications, including heavy-duty transportation sectors like buses, trucks, trains, and marine vessels, as well as solutions for material handling equipment and critical backup power systems. Beyond products, Ballard extends its expertise through technology solutions, providing engineering services, technology transfer, and licensing its extensive intellectual property and core knowledge for diverse PEM fuel cell uses. They also deliver integrated hydrogen fuel cell powertrain and vehicle systems. The company maintains a broad international presence, with operations spanning numerous countries including China, Germany, the United States, the United Kingdom, Canada, Denmark, Norway, Belgium, Japan, France, Spain, Taiwan, Poland, India, Ukraine, and Sweden. A significant strategic partnership exists with Linamar Corporation, focused on jointly developing and marketing fuel cell powertrains and components designed for Class 1 and 2 vehicles across North America and Europe. Established in 1979, Ballard Power Systems Inc. is headquartered in Burnaby, Canada.
Day range
Current $2.00
52-week range
Current $2.00
Recent quarterly results
Recent quarterly results
Third-party consensus; not a GoAI recommendation.
Funds reporting this stock among their holdings, ordered by reported position size.
 State Street SPDR S&P Kensho New Economies Composite ETFKOMP5.81M0.22%2.69B USD0.20%$66.40-2.23%
 Invesco WilderHill Clean Energy ETFPBW4.78M1.37%347.46M USD0.63%$28.92-2.89%
 Global X - Hydrogen ETFHYDR3.02M3.03%99.8M USD0.50%$43.50-3.44%
 State Street SPDR S&P Kensho Clean Power ETFCNRG2.86M1.59%185.17M USD0.45%$86.04-2.18%
 First Trust NASDAQ Clean Edge Green Energy Index FundQCLN1.16M0.20%575.99M USD0.59%$49.44-2.62%
 ALPS Clean Energy ETFACES908.19K0.92%99M USD0.55%$27.85-2.05%
 Invesco Global Clean Energy ETFPBD881.4K0.75%117.26M USD0.75%$16.74-1.93%
 State Street SPDR S&P Kensho Smart Mobility ETFHAIL134.77K0.75%17.97M USD0.45%$33.905-1.78%State Street SPDR S&P Kensho New Economies Composite ETFKOMPInvesco WilderHill Clean Energy ETFPBWGlobal X - Hydrogen ETFHYDRState Street SPDR S&P Kensho Clean Power ETFCNRGFirst Trust NASDAQ Clean Edge Green Energy Index FundQCLNALPS Clean Energy ETFACESInvesco Global Clean Energy ETFPBDState Street SPDR S&P Kensho Smart Mobility ETFHAIL
AI-generated and delayed market data for informational and educational purposes only. Not investment advice.