Loading
NASDAQConsumer DefensivePackaged Foods
Latest quote
$19.21
−$0.16 · -0.83%
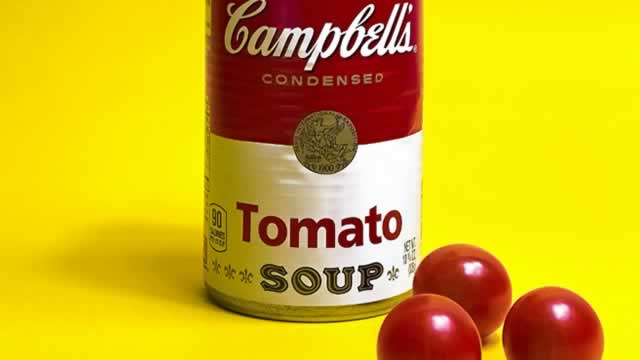
Campbell Soup Company (CPB) is a leading international producer and marketer of a wide variety of food and beverage products. The enterprise conducts its business through two main operational divisions: Meals & Beverages and Snacks. The Meals & Beverages segment serves both retail and food service industries throughout the United States and Canada. Its extensive product range includes classic Campbell's condensed and ready-to-enjoy soups; Swanson brand broths and stocks; Pacific Foods' line of broths, soups, and non-dairy beverages; Prego pasta sauces; Pace brand Mexican sauces; Campbell's gravies, pasta dishes, beans, and dinner sauces; Swanson canned poultry; Plum organic baby food and snacks; V8 juices and drinks; and Campbell's tomato juice. The Snacks division primarily targets the retail sector, with a significant presence in Latin America. This segment offers a diverse array of treats, such as Pepperidge Farm's selection of cookies, crackers, fresh bakery items, and frozen goods, including Milano cookies and Goldfish crackers. Other notable brands within this category are Snyder's of Hanover pretzels, Lance sandwich crackers, Cape Cod and Kettle Brand potato chips, Late July snacks, Snack Factory Pretzel Crisps, Pop Secret popcorn, Emerald nuts, and numerous other snacking options. Campbell Soup Company employs a comprehensive distribution strategy, selling its merchandise across an extensive network that encompasses major retail food chains, mass discounters and merchandisers, club stores, convenience stores, drug stores, and dollar stores. Additionally, products are available via e-commerce platforms, various other retail, commercial, and non-commercial establishments, and a system of independent contractor distributors. Established in 1869, the company's corporate headquarters are situated in Camden, New Jersey.
Previous close
$19.21
−$0.16 · -0.83%
Regular session · ET · Market data may be delayed.
Campbell Soup Company (CPB) is a leading international producer and marketer of a wide variety of food and beverage products. The enterprise conducts its business through two main operational divisions: Meals & Beverages and Snacks. The Meals & Beverages segment serves both retail and food service industries throughout the United States and Canada. Its extensive product range includes classic Campbell's condensed and ready-to-enjoy soups; Swanson brand broths and stocks; Pacific Foods' line of broths, soups, and non-dairy beverages; Prego pasta sauces; Pace brand Mexican sauces; Campbell's gravies, pasta dishes, beans, and dinner sauces; Swanson canned poultry; Plum organic baby food and snacks; V8 juices and drinks; and Campbell's tomato juice. The Snacks division primarily targets the retail sector, with a significant presence in Latin America. This segment offers a diverse array of treats, such as Pepperidge Farm's selection of cookies, crackers, fresh bakery items, and frozen goods, including Milano cookies and Goldfish crackers. Other notable brands within this category are Snyder's of Hanover pretzels, Lance sandwich crackers, Cape Cod and Kettle Brand potato chips, Late July snacks, Snack Factory Pretzel Crisps, Pop Secret popcorn, Emerald nuts, and numerous other snacking options. Campbell Soup Company employs a comprehensive distribution strategy, selling its merchandise across an extensive network that encompasses major retail food chains, mass discounters and merchandisers, club stores, convenience stores, drug stores, and dollar stores. Additionally, products are available via e-commerce platforms, various other retail, commercial, and non-commercial establishments, and a system of independent contractor distributors. Established in 1869, the company's corporate headquarters are situated in Camden, New Jersey.
Day range
Current $19.21
52-week range
Current $19.21
Regular session · ET · Market data may be delayed.
GoAI Score
Buy
Valuation
94
Deep Value
Sentiment
65
Bullish
Risk
40
Moderate Risk
Momentum
35
Weakening
Full GoAI research
Thesis, catalysts, evidence, and risk analysis.
Campbell Soup Company (CPB) is a leading international producer and marketer of a wide variety of food and beverage products. The enterprise conducts its business through two main operational divisions: Meals & Beverages and Snacks. The Meals & Beverages segment serves both retail and food service industries throughout the United States and Canada. Its extensive product range includes classic Campbell's condensed and ready-to-enjoy soups; Swanson brand broths and stocks; Pacific Foods' line of broths, soups, and non-dairy beverages; Prego pasta sauces; Pace brand Mexican sauces; Campbell's gravies, pasta dishes, beans, and dinner sauces; Swanson canned poultry; Plum organic baby food and snacks; V8 juices and drinks; and Campbell's tomato juice. The Snacks division primarily targets the retail sector, with a significant presence in Latin America. This segment offers a diverse array of treats, such as Pepperidge Farm's selection of cookies, crackers, fresh bakery items, and frozen goods, including Milano cookies and Goldfish crackers. Other notable brands within this category are Snyder's of Hanover pretzels, Lance sandwich crackers, Cape Cod and Kettle Brand potato chips, Late July snacks, Snack Factory Pretzel Crisps, Pop Secret popcorn, Emerald nuts, and numerous other snacking options. Campbell Soup Company employs a comprehensive distribution strategy, selling its merchandise across an extensive network that encompasses major retail food chains, mass discounters and merchandisers, club stores, convenience stores, drug stores, and dollar stores. Additionally, products are available via e-commerce platforms, various other retail, commercial, and non-commercial establishments, and a system of independent contractor distributors. Established in 1869, the company's corporate headquarters are situated in Camden, New Jersey.
Day range
Current $19.21
52-week range
Current $19.21
Profitability as a percentage of reported revenue.
Revenue
Operating income
Net income
| Metric (USD) | FY2026 | FY2025 | FY2024 | FY2023 | FY2022 |
|---|---|---|---|---|---|
| Revenue | 9.74B USD | 10.25B USD | 9.64B USD | 9.36B USD | 8.56B USD |
| Cost of goods sold | 7B USD | 7.13B USD | 6.67B USD | 6.44B USD | 5.94B USD |
| Gross profit | 2.74B USD | 3.12B USD | 2.97B USD | 2.92B USD | 2.63B USD |
| Research and development | 99M USD | 100M USD | 102M USD | 92M USD | 87M USD |
| Selling, general, and administrative | 1.55B USD | 1.6B USD | 1.57B USD | 1.47B USD | 1.35B USD |
| Operating expenses | 1.89B USD | 1.77B USD | 1.75B USD | 1.61B USD | 1.48B USD |
| Interest income | — | 17M USD | 6M USD | 4M USD | 1M USD |
| Interest expense | 323M USD | 345M USD | 249M USD | 188M USD | 189M USD |
| Depreciation and amortization | 413M USD | 434M USD | 411M USD | 387M USD | 337M USD |
| Operating income | 852M USD | 1.35B USD | 1.23B USD | 1.31B USD | 1.15B USD |
| Net income | 403M USD | 602M USD | 567M USD | 858M USD | 757M USD |
Company facts updated Oct 11, 2026.
Recent quarterly results
Recent quarterly results
Third-party consensus; not a GoAI recommendation.
Average target
$19.73
2.71% upsideCash distributions grouped by calendar year; partial years are marked.
$1.56
2025 complete year+5.4% since 2021
2026 partial: $1.42
$1.48
2,021
$1.48
2,022
$1.48
2,023
$1.48
2,024
$1.56
2,025
$1.42
2,026*
* Partial calendar year in the available dividend history.
| Action | Ex-dividend date | Details | Record date | Payment date |
|---|---|---|---|---|
Dividend | Oct 1, 2026 | $0.25Quarterly | Oct 1, 2026 | Nov 2, 2026 |
Dividend | Jul 2, 2026 | $0.39Quarterly | Jul 2, 2026 | Aug 3, 2026 |
Dividend | Apr 2, 2026 | $0.39Quarterly | Apr 2, 2026 | May 4, 2026 |
Dividend | Jan 8, 2026 | $0.39Quarterly | Jan 8, 2026 | Feb 2, 2026 |
Dividend | Oct 2, 2025 | $0.39Quarterly | Oct 2, 2025 | Nov 3, 2025 |
Dividend | Jul 3, 2025 | $0.39Quarterly | Jul 3, 2025 | Aug 4, 2025 |
Ex-dividend Oct 1, 2026
$0.25
Quarterly
Record Oct 1, 2026 · Payment Nov 2, 2026
Ex-dividend Jul 2, 2026
$0.39
Quarterly
Record Jul 2, 2026 · Payment Aug 3, 2026
Ex-dividend Apr 2, 2026
$0.39
Quarterly
Record Apr 2, 2026 · Payment May 4, 2026
Ex-dividend Jan 8, 2026
$0.39
Quarterly
Record Jan 8, 2026 · Payment Feb 2, 2026
Ex-dividend Oct 2, 2025
$0.39
Quarterly
Record Oct 2, 2025 · Payment Nov 3, 2025
Ex-dividend Jul 3, 2025
$0.39
Quarterly
Record Jul 3, 2025 · Payment Aug 4, 2025
Funds reporting this stock among their holdings, ordered by reported position size.
 iShares Core S&P Small-Cap ETFIJR224.19M0.22%103.19B USD0.06%$137.55+0.17%
 Vanguard Morningstar Total Stock Market ETFVTI157.29M0.01%2.3T USD0.03%$381.94+0.63%
 Vanguard Morningstar Small-Cap ETFVB113.65M0.06%185.3B USD0.03%$289.48+0.64%
 iShares Select Dividend ETFDVY81.75M0.36%22.51B USD0.38%$154.36-0.69%
 Dimensional - US Targeted Value ETFDFAT64.97M0.21%30.12B USD0.33%$67.27-0.43%
 Vanguard Morningstar Small-Cap Value ETFVBR57.79M0.08%68.2B USD0.05%$234.43+0.22%
 Vanguard Extended Market ETFVXF54.12M0.06%95.4B USD0.05%$235+0.80%
 U.S. Small Cap Value Portfolio ETF Class SharesDFSV38.63M0.14%26.81B USD0.33%$37.95-0.39%iShares Core S&P Small-Cap ETFIJRVanguard Morningstar Total Stock Market ETFVTIVanguard Morningstar Small-Cap ETFVBiShares Select Dividend ETFDVYDimensional - US Targeted Value ETFDFATVanguard Morningstar Small-Cap Value ETFVBRVanguard Extended Market ETFVXFU.S. Small Cap Value Portfolio ETF Class SharesDFSV
AI-generated and delayed market data for informational and educational purposes only. Not investment advice.