Loading
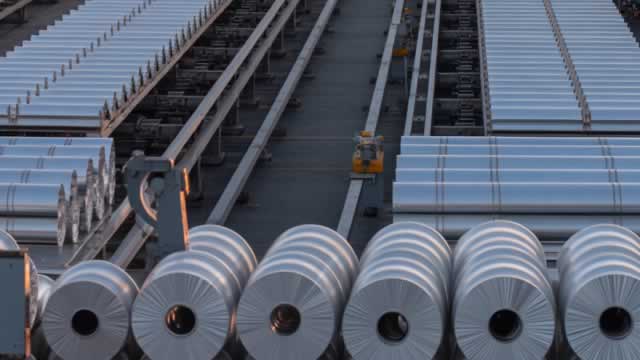
Constellium SE, along with its various subsidiaries, specializes in the development, production, and distribution of high-performance rolled and extruded aluminum solutions. These solutions primarily serve the packaging, aerospace, and automotive industries. Its operations are structured into three distinct business segments: Packaging & Automotive Rolled Products, Aerospace & Transportation, and Automotive Structures & Industry. The Packaging & Automotive Rolled Products division manufactures rolled aluminum materials. This includes stock for beverage and food cans and closures, as well as foil for flexible packaging applications. Additionally, this segment provides crucial components for the automotive sector, such as body sheets and heat exchangers, alongside specialized reflective sheets. Within the Aerospace & Transportation segment, the company supplies an array of rolled aluminum products. These encompass plates, sheets, and extrusions specifically tailored for aerospace applications, including wing skins. Furthermore, it delivers plates and sheets for various transportation, industrial, and defense uses. The Automotive Structures & Industry division is responsible for advanced extruded products and structural components designed for the automotive sector. Its offerings include critical items like crash-management systems, body structures, side impact beams, and battery enclosures. It also produces both hard and soft alloy extruded profiles utilized across diverse industrial contexts, spanning automotive, engineering, rail, and other transport-related markets. Beyond manufacturing, this segment delivers value-added downstream services such as pre-machining, surface treatment, research and development, and comprehensive technical support. Constellium distributes its products either directly to customers or via a network of distributors. Its global footprint includes sales operations in European nations such as France, Germany, the Czech Republic, the United Kingdom, and Switzerland, as well as in the United States, Shanghai, and Seoul. Established in 2010, Constellium SE maintains its corporate headquarters in Paris, France.
Previous close
$25.81
+$0.21 · +0.82%
Regular session · ET · Market data may be delayed.
Constellium SE, along with its various subsidiaries, specializes in the development, production, and distribution of high-performance rolled and extruded aluminum solutions. These solutions primarily serve the packaging, aerospace, and automotive industries. Its operations are structured into three distinct business segments: Packaging & Automotive Rolled Products, Aerospace & Transportation, and Automotive Structures & Industry. The Packaging & Automotive Rolled Products division manufactures rolled aluminum materials. This includes stock for beverage and food cans and closures, as well as foil for flexible packaging applications. Additionally, this segment provides crucial components for the automotive sector, such as body sheets and heat exchangers, alongside specialized reflective sheets. Within the Aerospace & Transportation segment, the company supplies an array of rolled aluminum products. These encompass plates, sheets, and extrusions specifically tailored for aerospace applications, including wing skins. Furthermore, it delivers plates and sheets for various transportation, industrial, and defense uses. The Automotive Structures & Industry division is responsible for advanced extruded products and structural components designed for the automotive sector. Its offerings include critical items like crash-management systems, body structures, side impact beams, and battery enclosures. It also produces both hard and soft alloy extruded profiles utilized across diverse industrial contexts, spanning automotive, engineering, rail, and other transport-related markets. Beyond manufacturing, this segment delivers value-added downstream services such as pre-machining, surface treatment, research and development, and comprehensive technical support. Constellium distributes its products either directly to customers or via a network of distributors. Its global footprint includes sales operations in European nations such as France, Germany, the Czech Republic, the United Kingdom, and Switzerland, as well as in the United States, Shanghai, and Seoul. Established in 2010, Constellium SE maintains its corporate headquarters in Paris, France.
Day range
Current $25.81
52-week range
Current $25.81
Regular session · ET · Market data may be delayed.
GoAI Score
Buy
Valuation
99
Deep Value
Sentiment
62
Bullish
Risk
48
Elevated Risk
Momentum
52
Neutral
Full GoAI research
Thesis, catalysts, evidence, and risk analysis.
Constellium SE, along with its various subsidiaries, specializes in the development, production, and distribution of high-performance rolled and extruded aluminum solutions. These solutions primarily serve the packaging, aerospace, and automotive industries. Its operations are structured into three distinct business segments: Packaging & Automotive Rolled Products, Aerospace & Transportation, and Automotive Structures & Industry. The Packaging & Automotive Rolled Products division manufactures rolled aluminum materials. This includes stock for beverage and food cans and closures, as well as foil for flexible packaging applications. Additionally, this segment provides crucial components for the automotive sector, such as body sheets and heat exchangers, alongside specialized reflective sheets. Within the Aerospace & Transportation segment, the company supplies an array of rolled aluminum products. These encompass plates, sheets, and extrusions specifically tailored for aerospace applications, including wing skins. Furthermore, it delivers plates and sheets for various transportation, industrial, and defense uses. The Automotive Structures & Industry division is responsible for advanced extruded products and structural components designed for the automotive sector. Its offerings include critical items like crash-management systems, body structures, side impact beams, and battery enclosures. It also produces both hard and soft alloy extruded profiles utilized across diverse industrial contexts, spanning automotive, engineering, rail, and other transport-related markets. Beyond manufacturing, this segment delivers value-added downstream services such as pre-machining, surface treatment, research and development, and comprehensive technical support. Constellium distributes its products either directly to customers or via a network of distributors. Its global footprint includes sales operations in European nations such as France, Germany, the Czech Republic, the United Kingdom, and Switzerland, as well as in the United States, Shanghai, and Seoul. Established in 2010, Constellium SE maintains its corporate headquarters in Paris, France.
Day range
Current $25.81
52-week range
Current $25.81
Profitability as a percentage of reported revenue.
Revenue
Operating income
Net income
| Metric (USD) | FY2025 | FY2024 | FY2023 | FY2022 | FY2021 |
|---|---|---|---|---|---|
| Revenue | 8.45B USD | 7.08B USD | 7.11B USD | 7.93B USD | 6.97B USD |
| Cost of goods sold | 7.59B USD | 6.18B USD | 6.15B USD | 7.03B USD | 6.21B USD |
| Gross profit | 857M USD | 905.83M USD | 958.68M USD | 894.89M USD | 751.79M USD |
| Research and development | 51M USD | 47.32M USD | 47.25M USD | 42.75M USD | 44.16M USD |
| Selling, general, and administrative | 332M USD | 302.26M USD | 288.06M USD | 263.91M USD | 292.11M USD |
| Operating expenses | 383M USD | 643.16M USD | 607.92M USD | 576.15M USD | 203.8M USD |
| Interest income | — | — | 16M USD | — | — |
| Interest expense | 114M USD | 112M USD | 115M USD | 126.12M USD | 154.84M USD |
| Depreciation and amortization | 330M USD | 293.57M USD | 275.07M USD | 287M USD | 302.3M USD |
| Operating income | 474M USD | 262.67M USD | 350.76M USD | 318.74M USD | 547.99M USD |
| Net income | 273M USD | 54.08M USD | 138.12M USD | 286.22M USD | 290.98M USD |
Company facts updated Oct 10, 2026.
Recent quarterly results
Recent quarterly results
Third-party consensus; not a GoAI recommendation.
Funds reporting this stock among their holdings, ordered by reported position size.
 iShares Russell 2000 ETFIWM85.91M0.11%78.27B USD0.19%$278.94+0.49%
 Avantis International Small Cap Value ETFAVDV64.51M0.32%20.04B USD0.36%$108.52+0.74%
 iShares Russell 2000 Growth ETFIWO30M0.22%13.97B USD0.24%$356.78+0.94%
 Vanguard Russell 2000 ETFVTWO20.58M0.11%18B USD0.06%$112.66+0.50%
 Vanguard Materials ETFVAW9.51M0.21%4.5B USD0.09%$221.57+0.48%
 Avantis International Equity ETFAVDE9.18M0.05%19.22B USD0.23%$89.80+0.58%
 Principal U.S. Small-Cap Multi-Factor ETFPSC8.06M0.30%2.7B USD0.38%$67.70+0.61%
 Janus Henderson Small/Mid Cap Growth Alpha ETFJSMD5.83M0.56%1.05B USD0.30%$91.44+1.13%iShares Russell 2000 ETFIWMAvantis International Small Cap Value ETFAVDViShares Russell 2000 Growth ETFIWOVanguard Russell 2000 ETFVTWOVanguard Materials ETFVAWAvantis International Equity ETFAVDEPrincipal U.S. Small-Cap Multi-Factor ETFPSCJanus Henderson Small/Mid Cap Growth Alpha ETFJSMD
AI-generated and delayed market data for informational and educational purposes only. Not investment advice.