Loading

NYSEBasic MaterialsConstruction Materials
Latest quote
$164.7
−$2.60 · -1.55%
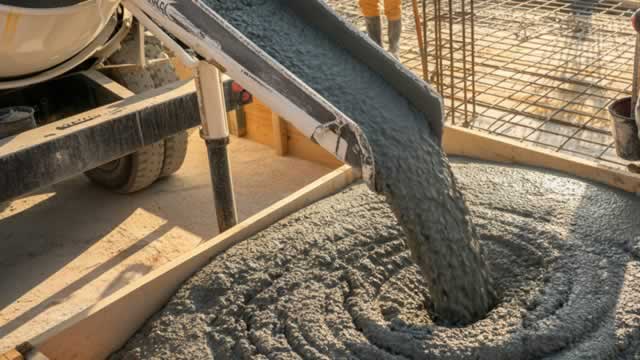
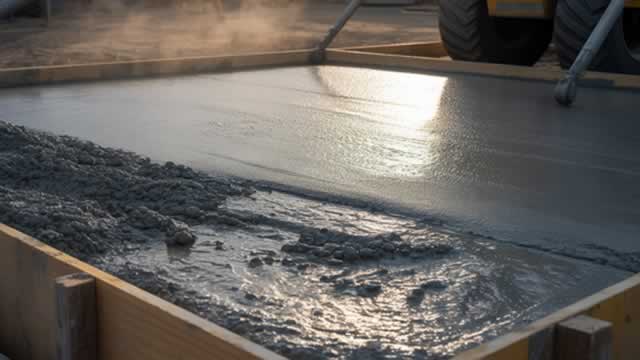
Eagle Materials Inc., operating through its subsidiaries across the United States, stands as a key producer and supplier of both heavy construction and light building materials. The company's diverse operations are organized into distinct segments: Cement; Concrete and Aggregates; Gypsum Wallboard; and Recycled Paperboard. Its core activities involve the mining of limestone for the comprehensive manufacture, distribution, and sale of Portland cement, alongside the grinding and distribution of slag. Additionally, Eagle Materials extracts gypsum to produce and market gypsum wallboard, an essential product utilized for finishing interior walls and ceilings in residential, commercial, and industrial structures. The firm also engages in the production and sale of recycled paperboard, catering to the gypsum wallboard industry and other paperboard converters, while also providing containerboard and lightweight packaging grades. Furthermore, its product portfolio includes ready-mix concrete, complemented by the mining, extraction, and sale of various aggregates such as crushed stone, sand, and gravel. These fundamental materials are integral to a broad spectrum of projects, ranging from residential and commercial building construction to public infrastructure developments and the critical construction, expansion, and repair of roads and highways. Established in 1963, the company was initially known as Centex Construction Products, Inc. before rebranding to Eagle Materials Inc. in January 2004. Its corporate headquarters are located in Dallas, Texas.
Previous close
$164.7
−$2.60 · -1.55%
Regular session · ET · Market data may be delayed.
Eagle Materials Inc., operating through its subsidiaries across the United States, stands as a key producer and supplier of both heavy construction and light building materials. The company's diverse operations are organized into distinct segments: Cement; Concrete and Aggregates; Gypsum Wallboard; and Recycled Paperboard. Its core activities involve the mining of limestone for the comprehensive manufacture, distribution, and sale of Portland cement, alongside the grinding and distribution of slag. Additionally, Eagle Materials extracts gypsum to produce and market gypsum wallboard, an essential product utilized for finishing interior walls and ceilings in residential, commercial, and industrial structures. The firm also engages in the production and sale of recycled paperboard, catering to the gypsum wallboard industry and other paperboard converters, while also providing containerboard and lightweight packaging grades. Furthermore, its product portfolio includes ready-mix concrete, complemented by the mining, extraction, and sale of various aggregates such as crushed stone, sand, and gravel. These fundamental materials are integral to a broad spectrum of projects, ranging from residential and commercial building construction to public infrastructure developments and the critical construction, expansion, and repair of roads and highways. Established in 1963, the company was initially known as Centex Construction Products, Inc. before rebranding to Eagle Materials Inc. in January 2004. Its corporate headquarters are located in Dallas, Texas.
Day range
Current $164.7
52-week range
Current $164.7
Regular session · ET · Market data may be delayed.
GoAI Score
Hold
Valuation
76
Undervalued
Sentiment
71
Bullish
Risk
39
Moderate Risk
Momentum
35
Weakening
Full GoAI research
Thesis, catalysts, evidence, and risk analysis.
Eagle Materials Inc., operating through its subsidiaries across the United States, stands as a key producer and supplier of both heavy construction and light building materials. The company's diverse operations are organized into distinct segments: Cement; Concrete and Aggregates; Gypsum Wallboard; and Recycled Paperboard. Its core activities involve the mining of limestone for the comprehensive manufacture, distribution, and sale of Portland cement, alongside the grinding and distribution of slag. Additionally, Eagle Materials extracts gypsum to produce and market gypsum wallboard, an essential product utilized for finishing interior walls and ceilings in residential, commercial, and industrial structures. The firm also engages in the production and sale of recycled paperboard, catering to the gypsum wallboard industry and other paperboard converters, while also providing containerboard and lightweight packaging grades. Furthermore, its product portfolio includes ready-mix concrete, complemented by the mining, extraction, and sale of various aggregates such as crushed stone, sand, and gravel. These fundamental materials are integral to a broad spectrum of projects, ranging from residential and commercial building construction to public infrastructure developments and the critical construction, expansion, and repair of roads and highways. Established in 1963, the company was initially known as Centex Construction Products, Inc. before rebranding to Eagle Materials Inc. in January 2004. Its corporate headquarters are located in Dallas, Texas.
Day range
Current $164.7
52-week range
Current $164.7
Profitability as a percentage of reported revenue.
Revenue
Operating income
Net income
| Metric (USD) | FY2025 | FY2024 | FY2023 | FY2022 | FY2021 |
|---|---|---|---|---|---|
| Revenue | 2.31B USD | 2.26B USD | 2.26B USD | 2.15B USD | 1.86B USD |
| Cost of goods sold | 1.66B USD | 1.59B USD | 1.57B USD | 1.51B USD | 1.34B USD |
| Gross profit | 652.54M USD | 673.14M USD | 685.32M USD | 639.27M USD | 519.61M USD |
| Selling, general, and administrative | 89.18M USD | 73.94M USD | 59.8M USD | 53.63M USD | 46.8M USD |
| Operating expenses | 91.65M USD | 73.94M USD | 59.8M USD | 53.63M USD | 46.8M USD |
| Interest income | 6.16M USD | 1.72M USD | 1.04M USD | 421K USD | 39K USD |
| Interest expense | 58.99M USD | 42.24M USD | 43.3M USD | 35.59M USD | 30.91M USD |
| Depreciation and amortization | 164.75M USD | 158.9M USD | 149.83M USD | 138.55M USD | 128.81M USD |
| Operating income | 560.87M USD | 599.2M USD | 625.53M USD | 585.64M USD | 472.81M USD |
| Net income | 423.81M USD | 463.42M USD | 477.64M USD | 461.54M USD | 374.25M USD |
Company facts updated Oct 11, 2026.
Reported history and fiscal-year consensus
Reported history and fiscal-year consensus
Third-party consensus; not a GoAI recommendation.
| Action | Effective date | Details | Record date | Payment date |
|---|---|---|---|---|
Stock split | Feb 27, 2006 | 3:1 | — | — |
Effective Feb 27, 2006
3:1
Funds reporting this stock among their holdings, ordered by reported position size.
 Vanguard Morningstar Total Stock Market ETFVTI191.18M0.01%2.3T USD0.03%$381.94+0.63%
 Vanguard Morningstar Small-Cap ETFVB138.24M0.07%185.3B USD0.03%$289.48+0.64%
 Avantis U.S. Small Cap Value ETFAVUV118.28M0.38%30.85B USD0.25%$119.64-0.41%
 Vanguard Morningstar Small-Cap Growth ETFVBK79.4M0.17%44.7B USD0.05%$344.74+1.22%
 Vanguard Extended Market ETFVXF70.95M0.07%95.4B USD0.05%$235+0.80%
 Global X - U.S. Infrastructure Development ETFPAVE42M0.31%13.67B USD0.47%$53.45+0.38%
 State Street SPDR S&P MIDCAP 400 ETF TrustMDY38.13M0.15%25.82B USD0.23%$669.87+0.54%
 Dimensional - US Small Cap ETFDFAS37.12M0.11%33.87B USD0.31%$78.35+0.32%Vanguard Morningstar Total Stock Market ETFVTIVanguard Morningstar Small-Cap ETFVBAvantis U.S. Small Cap Value ETFAVUVVanguard Morningstar Small-Cap Growth ETFVBKVanguard Extended Market ETFVXFGlobal X - U.S. Infrastructure Development ETFPAVEState Street SPDR S&P MIDCAP 400 ETF TrustMDYDimensional - US Small Cap ETFDFAS
AI-generated and delayed market data for informational and educational purposes only. Not investment advice.