Loading
NYSEIndustrialsRental & Leasing Services
Latest quote
$162.78
−$0.56 · -0.34%
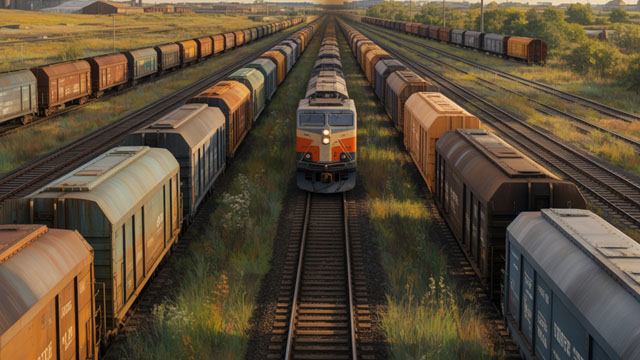
GATX Corporation, established in Chicago, Illinois in 1898, is a prominent global equipment lessor. The company primarily provides railcar and locomotive leasing services across North America and internationally, catering to vital industries such as petroleum, chemicals, food/agriculture, and transportation. Its operational framework is divided into three key segments: Rail North America, Rail International, and Portfolio Management. Beyond simply supplying equipment, GATX offers a comprehensive suite of support and maintenance services for its rail fleet. These include interior cleaning, routine upkeep and repairs to car bodies and safety features, ensuring regulatory compliance, facilitating wheelset replacements, performing interior blasting and lining, exterior painting, and applying car stenciling. Furthermore, GATX's activities extend to leasing aircraft spare engines (including units it directly owns) and managing a small collection of five liquefied gas-carrying vessels. The company also applies its expertise to overseeing asset portfolios on behalf of third parties. GATX maintains a substantial asset base, comprising approximately 147,000 railcars, a combined fleet of 568 locomotives (539 four-axle and 29 six-axle), and its five specialized vessels.
Latest quote
$162.78
−$0.56 · -0.34%
After-hours
$162.78
$0.00 · 0.00%
Oct 8, 4:00 PM ET
Regular session · ET · Market data may be delayed.
GATX Corporation, established in Chicago, Illinois in 1898, is a prominent global equipment lessor. The company primarily provides railcar and locomotive leasing services across North America and internationally, catering to vital industries such as petroleum, chemicals, food/agriculture, and transportation. Its operational framework is divided into three key segments: Rail North America, Rail International, and Portfolio Management. Beyond simply supplying equipment, GATX offers a comprehensive suite of support and maintenance services for its rail fleet. These include interior cleaning, routine upkeep and repairs to car bodies and safety features, ensuring regulatory compliance, facilitating wheelset replacements, performing interior blasting and lining, exterior painting, and applying car stenciling. Furthermore, GATX's activities extend to leasing aircraft spare engines (including units it directly owns) and managing a small collection of five liquefied gas-carrying vessels. The company also applies its expertise to overseeing asset portfolios on behalf of third parties. GATX maintains a substantial asset base, comprising approximately 147,000 railcars, a combined fleet of 568 locomotives (539 four-axle and 29 six-axle), and its five specialized vessels.
Day range
Current $162.78
52-week range
Current $162.78
Regular session · ET · Market data may be delayed.
GoAI Score
Hold
Valuation
63
Undervalued
Sentiment
69
Bullish
Risk
32
Moderate Risk
Momentum
46
Neutral
Full GoAI research
Thesis, catalysts, evidence, and risk analysis.
GATX Corporation, established in Chicago, Illinois in 1898, is a prominent global equipment lessor. The company primarily provides railcar and locomotive leasing services across North America and internationally, catering to vital industries such as petroleum, chemicals, food/agriculture, and transportation. Its operational framework is divided into three key segments: Rail North America, Rail International, and Portfolio Management. Beyond simply supplying equipment, GATX offers a comprehensive suite of support and maintenance services for its rail fleet. These include interior cleaning, routine upkeep and repairs to car bodies and safety features, ensuring regulatory compliance, facilitating wheelset replacements, performing interior blasting and lining, exterior painting, and applying car stenciling. Furthermore, GATX's activities extend to leasing aircraft spare engines (including units it directly owns) and managing a small collection of five liquefied gas-carrying vessels. The company also applies its expertise to overseeing asset portfolios on behalf of third parties. GATX maintains a substantial asset base, comprising approximately 147,000 railcars, a combined fleet of 568 locomotives (539 four-axle and 29 six-axle), and its five specialized vessels.
Day range
Current $162.78
52-week range
Current $162.78
Profitability as a percentage of reported revenue.
Revenue
Operating income
Net income
| Metric (USD) | FY2025 | FY2024 | FY2023 | FY2022 | FY2021 |
|---|---|---|---|---|---|
| Revenue | 1.74B USD | 1.59B USD | 1.41B USD | 1.27B USD | 1.26B USD |
| Cost of goods sold | 894.9M USD | 824.6M USD | 763.6M USD | 700.4M USD | 718.2M USD |
| Gross profit | 845.5M USD | 760.9M USD | 647.3M USD | 572.6M USD | 539.2M USD |
| Selling, general, and administrative | 252.6M USD | 236.3M USD | 212.7M USD | 195M USD | 198.3M USD |
| Operating expenses | 311.4M USD | 287.3M USD | 259.3M USD | 232.4M USD | 242.3M USD |
| Interest income | 29.4M USD | — | — | — | — |
| Interest expense | 419.8M USD | 341M USD | 263.4M USD | 214M USD | 204M USD |
| Depreciation and amortization | 452.3M USD | 421.4M USD | 392.1M USD | 371.3M USD | 378.4M USD |
| Operating income | 534.1M USD | 473.6M USD | 388M USD | 340.2M USD | 296.9M USD |
| Net income | 333.3M USD | 284.2M USD | 259.2M USD | 155.9M USD | 143.1M USD |
Company facts updated Oct 8, 2026.
Recent quarterly results
Recent quarterly results
Third-party consensus; not a GoAI recommendation.
Average target
$220
35.15% upsideCash distributions grouped by calendar year; partial years are marked.
$2.44
2025 complete year+22.0% since 2021
2026 partial: $1.98
$2.00
2,021
$2.08
2,022
$2.20
2,023
$2.32
2,024
$2.44
2,025
$1.98
2,026*
* Partial calendar year in the available dividend history.
| Action | Ex-dividend date | Details | Record date | Payment date |
|---|---|---|---|---|
Dividend | Sep 15, 2026 | $0.66Quarterly | Sep 15, 2026 | Sep 30, 2026 |
Dividend | Jun 15, 2026 | $0.66Quarterly | Jun 15, 2026 | Jun 30, 2026 |
Dividend | Mar 2, 2026 | $0.66Quarterly | Mar 2, 2026 | Mar 31, 2026 |
Dividend | Dec 15, 2025 | $0.61Quarterly | Dec 15, 2025 | Dec 31, 2025 |
Dividend | Sep 15, 2025 | $0.61Quarterly | Sep 15, 2025 | Sep 30, 2025 |
Dividend | Jun 13, 2025 | $0.61Quarterly | Jun 13, 2025 | Jun 30, 2025 |
Ex-dividend Sep 15, 2026
$0.66
Quarterly
Record Sep 15, 2026 · Payment Sep 30, 2026
Ex-dividend Jun 15, 2026
$0.66
Quarterly
Record Jun 15, 2026 · Payment Jun 30, 2026
Ex-dividend Mar 2, 2026
$0.66
Quarterly
Record Mar 2, 2026 · Payment Mar 31, 2026
Ex-dividend Dec 15, 2025
$0.61
Quarterly
Record Dec 15, 2025 · Payment Dec 31, 2025
Ex-dividend Sep 15, 2025
$0.61
Quarterly
Record Sep 15, 2025 · Payment Sep 30, 2025
Ex-dividend Jun 13, 2025
$0.61
Quarterly
Record Jun 13, 2025 · Payment Jun 30, 2025
Funds reporting this stock among their holdings, ordered by reported position size.
 Avantis U.S. Small Cap Value ETFAVUV264.3M0.86%30.54B USD0.25%$120.13+0.84%
 Vanguard Morningstar Total Stock Market ETFVTI197.76M0.01%2.3T USD0.03%$379.56-0.39%
 iShares Russell 2000 ETFIWM153.07M0.20%78.56B USD0.19%$277.57-0.05%
 Vanguard Morningstar Small-Cap ETFVB143M0.08%185.3B USD0.03%$287.63+0.23%
 Guggenheim Funds Trust - Guggenheim Ultra Short Income ETFGCSH109.35M0.23%145.5M USD0.25%$49.84+0.03%
 Vanguard Morningstar Small-Cap Value ETFVBR90.8M0.13%68.2B USD0.05%$233.91+0.75%
 Vanguard Extended Market ETFVXF72.15M0.07%95.4B USD0.05%$233.13-0.15%
 Dimensional - US Targeted Value ETFDFAT59.88M0.20%30B USD0.33%$67.56+0.72%Avantis U.S. Small Cap Value ETFAVUVVanguard Morningstar Total Stock Market ETFVTIiShares Russell 2000 ETFIWMVanguard Morningstar Small-Cap ETFVBGuggenheim Funds Trust - Guggenheim Ultra Short Income ETFGCSHVanguard Morningstar Small-Cap Value ETFVBRVanguard Extended Market ETFVXFDimensional - US Targeted Value ETFDFAT
AI-generated and delayed market data for informational and educational purposes only. Not investment advice.