Loading
NASDAQIndustrialsIndustrial - Machinery
Latest quote
$3.02
−$0.20 · -6.21%
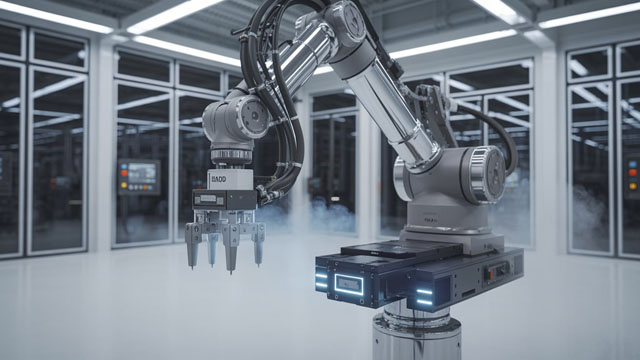
Established in 2016 and based in Quanzhou, People's Republic of China, INLIF Limited specializes in the design, production, and sale of iNLIF-branded robotic arms tailored for injection molding machines. The company's diverse product range includes transverse manipulator arms with single or dual axes, multi-axis arms capable of both transverse and longitudinal movement, and substantial bullhead multi-axis units. Furthermore, INLIF provides essential accessories such as conveyor systems, sturdy welded bases, and specific reducer mounting plates. The firm also offers professional installation support for its robotic arm solutions.
Previous close
$3.02
−$0.20 · -6.21%
After-hours
$3.0792
+$0.0592 · +1.96%
Oct 9, 7:44 PM ET
Regular session · ET · Market data may be delayed.
Established in 2016 and based in Quanzhou, People's Republic of China, INLIF Limited specializes in the design, production, and sale of iNLIF-branded robotic arms tailored for injection molding machines. The company's diverse product range includes transverse manipulator arms with single or dual axes, multi-axis arms capable of both transverse and longitudinal movement, and substantial bullhead multi-axis units. Furthermore, INLIF provides essential accessories such as conveyor systems, sturdy welded bases, and specific reducer mounting plates. The firm also offers professional installation support for its robotic arm solutions.
Day range
Current $3.02
52-week range
Current $3.02
Regular session · ET · Market data may be delayed.
GoAI Score
Sell
Valuation
47
Fair Value
Sentiment
53
Mixed
Risk
77
High Risk
Momentum
32
Weakening
Full GoAI research
Thesis, catalysts, evidence, and risk analysis.
Established in 2016 and based in Quanzhou, People's Republic of China, INLIF Limited specializes in the design, production, and sale of iNLIF-branded robotic arms tailored for injection molding machines. The company's diverse product range includes transverse manipulator arms with single or dual axes, multi-axis arms capable of both transverse and longitudinal movement, and substantial bullhead multi-axis units. Furthermore, INLIF provides essential accessories such as conveyor systems, sturdy welded bases, and specific reducer mounting plates. The firm also offers professional installation support for its robotic arm solutions.
Day range
Current $3.02
52-week range
Current $3.02
Profitability as a percentage of reported revenue.
Revenue
Operating income
Net income
| Metric (USD) | FY2025 | FY2024 | FY2023 | FY2022 | FY2021 |
|---|---|---|---|---|---|
| Revenue | 18.41M USD | 15.8M USD | 12.61M USD | 6.65M USD | 6.15M USD |
| Cost of goods sold | 14.11M USD | 11.24M USD | 8.45M USD | 4.36M USD | 4.16M USD |
| Gross profit | 4.29M USD | 4.55M USD | 4.16M USD | 2.29M USD | 2M USD |
| Research and development | 2.07M USD | 1.56M USD | 1.36M USD | 504.71K USD | 416.3K USD |
| Selling, general, and administrative | 8.04M USD | 1.7M USD | 1.41M USD | 1.14M USD | 1.23M USD |
| Operating expenses | 10.11M USD | 3.27M USD | 2.77M USD | 1.64M USD | 1.65M USD |
| Interest income | 3.58K USD | 3.27K USD | 6.88K USD | 2.63K USD | 3.06K USD |
| Interest expense | 157.28K USD | 196.3K USD | 146.39K USD | 82.67K USD | 74.99K USD |
| Depreciation and amortization | 327.53K USD | 347.98K USD | 367.03K USD | 388.23K USD | 406.91K USD |
| Operating income | −5.82M USD | 1.29M USD | 1.39M USD | 650.13K USD | 349.19K USD |
| Net income | −5.45M USD | 1.61M USD | 1.35M USD | 537.56K USD | 36.59K USD |
Company facts updated Oct 10, 2026.
Reported history and fiscal-year consensus
Reported history and fiscal-year consensus
| Action | Effective date | Details | Record date | Payment date |
|---|---|---|---|---|
Stock split | Jul 6, 2026 | 1:200 | — | — |
Stock split | Apr 6, 2026 | 1:16 | — | — |
Effective Jul 6, 2026
1:200
Effective Apr 6, 2026
1:16
AI-generated and delayed market data for informational and educational purposes only. Not investment advice.