Loading

NYSEIndustrialsAerospace & Defense
Latest quote
$509.59
+$1.70 · +0.33%
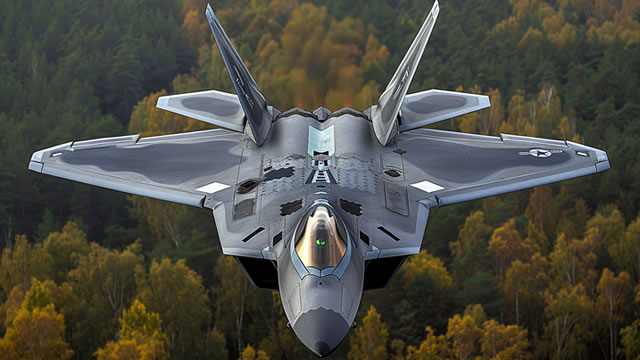
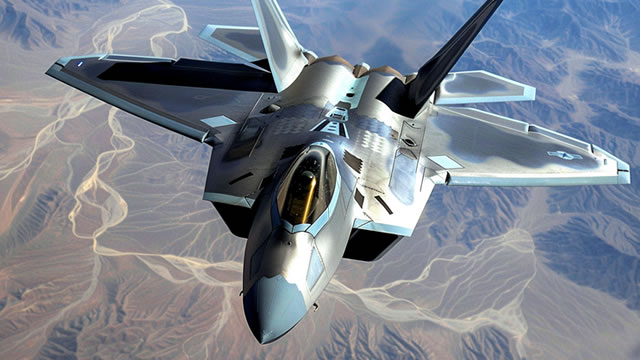
Lockheed Martin Corporation stands as a prominent global security and aerospace enterprise, specializing in the comprehensive lifecycle of advanced technological systems. Its expertise spans the research, design, development, manufacturing, integration, and ongoing sustainment of cutting-edge products and services across the world. The company's diverse operations are structured into four key segments: Aeronautics, Missiles and Fire Control, Rotary and Mission Systems, and Space. The Aeronautics division is responsible for creating and producing leading-edge combat and air mobility aircraft, alongside unmanned aerial vehicles and their related innovations. The Missiles and Fire Control segment delivers sophisticated air and missile defense systems; tactical and precision air-to-ground weapon systems; comprehensive logistics; advanced fire control; mission operations, readiness, engineering support, and integration services; both crewed and uncrewed ground vehicles; and energy management solutions. Within the Rotary and Mission Systems segment, the portfolio includes military and commercial helicopters, naval surface ships, land and sea-based missile defense systems, advanced radar technologies, maritime and airborne mission and combat systems, intricate command and control solutions, cybersecurity services, and simulation and training platforms. The Space division focuses on satellites, space transportation systems, strategic, advanced strike, and defensive missile systems, as well as classified systems and services vital for national security. This segment further enhances situational awareness through network enablement, integrating space and ground-based systems to empower customers in gathering, analyzing, and securely distributing crucial intelligence data. Lockheed Martin primarily serves the United States government, alongside fulfilling foreign military sales facilitated through U.S. government contracts. Established in 1912, the corporation maintains its headquarters in Bethesda, Maryland.
Previous close
$509.59
+$1.70 · +0.33%
Regular session · ET · Market data may be delayed.
Lockheed Martin Corporation stands as a prominent global security and aerospace enterprise, specializing in the comprehensive lifecycle of advanced technological systems. Its expertise spans the research, design, development, manufacturing, integration, and ongoing sustainment of cutting-edge products and services across the world. The company's diverse operations are structured into four key segments: Aeronautics, Missiles and Fire Control, Rotary and Mission Systems, and Space. The Aeronautics division is responsible for creating and producing leading-edge combat and air mobility aircraft, alongside unmanned aerial vehicles and their related innovations. The Missiles and Fire Control segment delivers sophisticated air and missile defense systems; tactical and precision air-to-ground weapon systems; comprehensive logistics; advanced fire control; mission operations, readiness, engineering support, and integration services; both crewed and uncrewed ground vehicles; and energy management solutions. Within the Rotary and Mission Systems segment, the portfolio includes military and commercial helicopters, naval surface ships, land and sea-based missile defense systems, advanced radar technologies, maritime and airborne mission and combat systems, intricate command and control solutions, cybersecurity services, and simulation and training platforms. The Space division focuses on satellites, space transportation systems, strategic, advanced strike, and defensive missile systems, as well as classified systems and services vital for national security. This segment further enhances situational awareness through network enablement, integrating space and ground-based systems to empower customers in gathering, analyzing, and securely distributing crucial intelligence data. Lockheed Martin primarily serves the United States government, alongside fulfilling foreign military sales facilitated through U.S. government contracts. Established in 1912, the corporation maintains its headquarters in Bethesda, Maryland.
Day range
Current $509.59
52-week range
Current $509.59
Regular session · ET · Market data may be delayed.
GoAI Score
Buy
Valuation
88
Deep Value
Sentiment
53
Mixed
Risk
29
Moderate Risk
Momentum
41
Neutral
Full GoAI research
Thesis, catalysts, evidence, and risk analysis.
Lockheed Martin Corporation stands as a prominent global security and aerospace enterprise, specializing in the comprehensive lifecycle of advanced technological systems. Its expertise spans the research, design, development, manufacturing, integration, and ongoing sustainment of cutting-edge products and services across the world. The company's diverse operations are structured into four key segments: Aeronautics, Missiles and Fire Control, Rotary and Mission Systems, and Space. The Aeronautics division is responsible for creating and producing leading-edge combat and air mobility aircraft, alongside unmanned aerial vehicles and their related innovations. The Missiles and Fire Control segment delivers sophisticated air and missile defense systems; tactical and precision air-to-ground weapon systems; comprehensive logistics; advanced fire control; mission operations, readiness, engineering support, and integration services; both crewed and uncrewed ground vehicles; and energy management solutions. Within the Rotary and Mission Systems segment, the portfolio includes military and commercial helicopters, naval surface ships, land and sea-based missile defense systems, advanced radar technologies, maritime and airborne mission and combat systems, intricate command and control solutions, cybersecurity services, and simulation and training platforms. The Space division focuses on satellites, space transportation systems, strategic, advanced strike, and defensive missile systems, as well as classified systems and services vital for national security. This segment further enhances situational awareness through network enablement, integrating space and ground-based systems to empower customers in gathering, analyzing, and securely distributing crucial intelligence data. Lockheed Martin primarily serves the United States government, alongside fulfilling foreign military sales facilitated through U.S. government contracts. Established in 1912, the corporation maintains its headquarters in Bethesda, Maryland.
Day range
Current $509.59
52-week range
Current $509.59
Profitability as a percentage of reported revenue.
Revenue
Operating income
Net income
| Metric (USD) | FY2025 | FY2024 | FY2023 | FY2022 | FY2021 |
|---|---|---|---|---|---|
| Revenue | 75.06B USD | 71.04B USD | 67.57B USD | 65.98B USD | 67.04B USD |
| Cost of goods sold | 67.43B USD | 64.11B USD | 59.09B USD | 57.7B USD | 57.98B USD |
| Gross profit | 7.62B USD | 6.93B USD | 8.48B USD | 8.29B USD | 9.06B USD |
| Research and development | 2B USD | 1.6B USD | 1.5B USD | 1.7B USD | 1.5B USD |
| Selling, general, and administrative | 50M USD | 137M USD | 499M USD | 865M USD | 1.24B USD |
| Operating expenses | −112M USD | −83M USD | −28M USD | −61M USD | −62M USD |
| Interest expense | 1.12B USD | 1.04B USD | 916M USD | 623M USD | 569M USD |
| Depreciation and amortization | 1.69B USD | 1.56B USD | 1.43B USD | 1.4B USD | 1.36B USD |
| Operating income | 7.73B USD | 7.01B USD | 8.51B USD | 8.35B USD | 9.12B USD |
| Net income | 5.02B USD | 5.34B USD | 6.92B USD | 5.73B USD | 6.32B USD |
Company facts updated Oct 11, 2026.
Recent quarterly results
Recent quarterly results
Third-party consensus; not a GoAI recommendation.
Average target
$635.33
24.67% upsideCash distributions grouped by calendar year; partial years are marked.
$13.35
2025 complete year+25.9% since 2021
2026 partial: $10.35
$10.60
2,021
$11.40
2,022
$12.15
2,023
$12.75
2,024
$13.35
2,025
$10.35
2,026*
* Partial calendar year in the available dividend history.
| Action | Ex-dividend date | Details | Record date | Payment date |
|---|---|---|---|---|
Dividend | Sep 1, 2026 | $3.45Quarterly | Sep 1, 2026 | Sep 25, 2026 |
Dividend | Jun 1, 2026 | $3.45Quarterly | Jun 1, 2026 | Jun 26, 2026 |
Dividend | Mar 2, 2026 | $3.45Quarterly | Mar 2, 2026 | Mar 27, 2026 |
Dividend | Dec 1, 2025 | $3.45Quarterly | Dec 1, 2025 | Dec 30, 2025 |
Dividend | Sep 2, 2025 | $3.30Quarterly | Sep 2, 2025 | Sep 26, 2025 |
Dividend | Jun 2, 2025 | $3.30Quarterly | Jun 2, 2025 | Jun 27, 2025 |
Ex-dividend Sep 1, 2026
$3.45
Quarterly
Record Sep 1, 2026 · Payment Sep 25, 2026
Ex-dividend Jun 1, 2026
$3.45
Quarterly
Record Jun 1, 2026 · Payment Jun 26, 2026
Ex-dividend Mar 2, 2026
$3.45
Quarterly
Record Mar 2, 2026 · Payment Mar 27, 2026
Ex-dividend Dec 1, 2025
$3.45
Quarterly
Record Dec 1, 2025 · Payment Dec 30, 2025
Ex-dividend Sep 2, 2025
$3.30
Quarterly
Record Sep 2, 2025 · Payment Sep 26, 2025
Ex-dividend Jun 2, 2025
$3.30
Quarterly
Record Jun 2, 2025 · Payment Jun 27, 2025
Funds reporting this stock among their holdings, ordered by reported position size.
 State Street SPDR S&P 500 ETF1557.T199.4B0.15%129.35T JPY0.09%¥122,850+0.12%
 Vanguard Morningstar Total Stock Market ETFVTI4.11B0.18%2.3T USD0.03%$381.94+0.63%
 Vanguard S&P 500 ETFVOO3.03B0.17%1.8T USD0.03%$715.59+0.61%
 Schwab U.S. Dividend Equity ETFSCHD2.89B2.62%110.32B USD0.06%$33.04-0.32%
 iShares Core S&P 500 ETFIVV1.37B0.15%896.44B USD0.03%$781.97+0.60%
 State Street SPDR S&P 500 ETFSPY1.26B0.15%817.2B USD0.09%$778.57+0.60%
 Vanguard Morningstar Value ETFVTV1.24B0.47%262.4B USD0.03%$220.59+0.44%
 Vanguard Dividend Appreciation ETFVIG644.59M0.49%132.4B USD0.04%$239.05+0.70%State Street SPDR S&P 500 ETF1557.TVanguard Morningstar Total Stock Market ETFVTIVanguard S&P 500 ETFVOOSchwab U.S. Dividend Equity ETFSCHDiShares Core S&P 500 ETFIVVState Street SPDR S&P 500 ETFSPYVanguard Morningstar Value ETFVTVVanguard Dividend Appreciation ETFVIG
AI-generated and delayed market data for informational and educational purposes only. Not investment advice.