Loading
NYSEIndustrialsEngineering & Construction
Latest quote
$214.79
−$8.585 · -3.84%
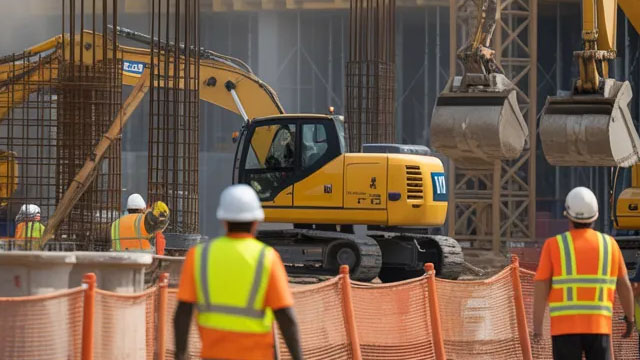
MasTec, Inc. is a leading infrastructure construction firm that delivers a comprehensive suite of services, encompassing engineering, construction, installation, maintenance, and enhancement. The company primarily serves the communications, energy, utility, and broader infrastructure sectors throughout the United States and Canada. Its operations are structured across distinct segments: Communications, Clean Energy and Infrastructure, Oil and Gas, Power Delivery, and Other. MasTec's construction activities involve building intricate underground and overhead distribution systems, essential for wireless and fiber-optic communication networks, as well as electrical grids. The company also develops clean energy infrastructure, including renewable energy facilities; pipelines for natural gas and other products, alongside extensive electrical and gas transmission and distribution systems. Furthermore, it specializes in heavy industrial plants, compressor and pumping stations, water and wastewater treatment facilities, and critical water and sewer pipelines, among other civil engineering projects. Additionally, the company manages the installation of power generation assets, buried and aerial fiber optic cabling, and smart home automation and energy management solutions. Beyond initial construction, MasTec offers comprehensive maintenance and upgrade solutions. These services range from routine upkeep of client networks and facilities (such as communications, power generation, pipeline, and electrical grids) to emergency restoration following natural disasters or accidents, and planned overhauls or system replacements. Its diverse clientele encompasses public and private energy providers, pipeline operators, various wireless and wireline/fiber service providers, broadband companies, install-to-the-home specialists, and governmental entities. Established in 1929, MasTec, Inc. maintains its headquarters in Coral Gables, Florida.
Regular session
$217.58
−$5.795 · -2.59%
Regular session · ET · Market data may be delayed.
MasTec, Inc. is a leading infrastructure construction firm that delivers a comprehensive suite of services, encompassing engineering, construction, installation, maintenance, and enhancement. The company primarily serves the communications, energy, utility, and broader infrastructure sectors throughout the United States and Canada. Its operations are structured across distinct segments: Communications, Clean Energy and Infrastructure, Oil and Gas, Power Delivery, and Other. MasTec's construction activities involve building intricate underground and overhead distribution systems, essential for wireless and fiber-optic communication networks, as well as electrical grids. The company also develops clean energy infrastructure, including renewable energy facilities; pipelines for natural gas and other products, alongside extensive electrical and gas transmission and distribution systems. Furthermore, it specializes in heavy industrial plants, compressor and pumping stations, water and wastewater treatment facilities, and critical water and sewer pipelines, among other civil engineering projects. Additionally, the company manages the installation of power generation assets, buried and aerial fiber optic cabling, and smart home automation and energy management solutions. Beyond initial construction, MasTec offers comprehensive maintenance and upgrade solutions. These services range from routine upkeep of client networks and facilities (such as communications, power generation, pipeline, and electrical grids) to emergency restoration following natural disasters or accidents, and planned overhauls or system replacements. Its diverse clientele encompasses public and private energy providers, pipeline operators, various wireless and wireline/fiber service providers, broadband companies, install-to-the-home specialists, and governmental entities. Established in 1929, MasTec, Inc. maintains its headquarters in Coral Gables, Florida.
Day range
Current $217.58
52-week range
Current $217.58
Regular session · ET · Market data may be delayed.
GoAI Score
Hold
Valuation
42
Fair Value
Sentiment
73
Bullish
Risk
53
Elevated Risk
Momentum
57
Neutral
Full GoAI research
Thesis, catalysts, evidence, and risk analysis.
MasTec, Inc. is a leading infrastructure construction firm that delivers a comprehensive suite of services, encompassing engineering, construction, installation, maintenance, and enhancement. The company primarily serves the communications, energy, utility, and broader infrastructure sectors throughout the United States and Canada. Its operations are structured across distinct segments: Communications, Clean Energy and Infrastructure, Oil and Gas, Power Delivery, and Other. MasTec's construction activities involve building intricate underground and overhead distribution systems, essential for wireless and fiber-optic communication networks, as well as electrical grids. The company also develops clean energy infrastructure, including renewable energy facilities; pipelines for natural gas and other products, alongside extensive electrical and gas transmission and distribution systems. Furthermore, it specializes in heavy industrial plants, compressor and pumping stations, water and wastewater treatment facilities, and critical water and sewer pipelines, among other civil engineering projects. Additionally, the company manages the installation of power generation assets, buried and aerial fiber optic cabling, and smart home automation and energy management solutions. Beyond initial construction, MasTec offers comprehensive maintenance and upgrade solutions. These services range from routine upkeep of client networks and facilities (such as communications, power generation, pipeline, and electrical grids) to emergency restoration following natural disasters or accidents, and planned overhauls or system replacements. Its diverse clientele encompasses public and private energy providers, pipeline operators, various wireless and wireline/fiber service providers, broadband companies, install-to-the-home specialists, and governmental entities. Established in 1929, MasTec, Inc. maintains its headquarters in Coral Gables, Florida.
Day range
Current $217.58
52-week range
Current $217.58
Profitability as a percentage of reported revenue.
Revenue
Operating income
Net income
| Metric (USD) | FY2025 | FY2024 | FY2023 | FY2022 | FY2021 |
|---|---|---|---|---|---|
| Revenue | 14.3B USD | 12.3B USD | 12B USD | 9.78B USD | 7.95B USD |
| Cost of goods sold | 12.93B USD | 10.68B USD | 11.21B USD | 8.59B USD | 6.81B USD |
| Gross profit | 1.37B USD | 1.63B USD | 786.81M USD | 1.19B USD | 1.15B USD |
| Selling, general, and administrative | 713.01M USD | 684.51M USD | 634.8M USD | 559.44M USD | 306.97M USD |
| Operating expenses | 713.01M USD | 1.19B USD | 634.8M USD | 1.07B USD | 729.8M USD |
| Interest expense | 172.99M USD | 193.27M USD | 234.41M USD | 112.26M USD | 53.41M USD |
| Depreciation and amortization | 427.08M USD | 506.62M USD | 603.16M USD | 507.15M USD | 422.83M USD |
| Operating income | 652.64M USD | 436.35M USD | 152.01M USD | 125.12M USD | 416.25M USD |
| Net income | 399.04M USD | 162.79M USD | −49.95M USD | 33.35M USD | 328.83M USD |
Company facts updated Oct 8, 2026.
Recent quarterly results
Recent quarterly results
Third-party consensus; not a GoAI recommendation.
Average target
$408.58
87.79% upsideCash distributions grouped by calendar year; partial years are marked.
$0.0889
1982 complete year+42.9% since 1978
$0.0622
1,978
$0.0711
1,979
$0.08
1,980
$0.0889
1,981
$0.0889
1,982
| Action | Ex-dividend date | Details | Record date | Payment date |
|---|---|---|---|---|
Dividend | Aug 4, 1982 | $0.20Annual | — | — |
Dividend | Aug 3, 1981 | $0.20Annual | — | — |
Dividend | Aug 4, 1980 | $0.18Annual | — | — |
Dividend | Jul 30, 1979 | $0.16Annual | — | — |
Dividend | Jun 27, 1978 | $0.14Annual | — | — |
Dividend | Jul 26, 1977 | $0.12Annual | — | — |
Ex-dividend Aug 4, 1982
$0.20
Annual
Ex-dividend Aug 3, 1981
$0.20
Annual
Ex-dividend Aug 4, 1980
$0.18
Annual
Ex-dividend Jul 30, 1979
$0.16
Annual
Ex-dividend Jun 27, 1978
$0.14
Annual
Ex-dividend Jul 26, 1977
$0.12
Annual
Funds reporting this stock among their holdings, ordered by reported position size.
 Vanguard Morningstar Total Stock Market ETFVTI481.96M0.02%2.3T USD0.03%$379.48-0.41%
 Vanguard Morningstar Small-Cap ETFVB348.81M0.19%185.3B USD0.03%$287.55+0.20%
 Vanguard Morningstar Small-Cap Growth ETFVBK200.13M0.44%44.7B USD0.05%$340.35-0.55%
 Vanguard Extended Market ETFVXF171.62M0.18%95.4B USD0.05%$233.21-0.12%
 Global X - U.S. Infrastructure Development ETFPAVE148.63M1.06%13.95B USD0.47%$53.215-0.14%
 iShares Large Cap Core Active ETFBLCR133.68M1.37%9.74B USD0.38%$49.94-0.60%
 State Street SPDR S&P MIDCAP 400 ETF TrustMDY105.95M0.41%25.98B USD0.23%$666.74+0.42%
 iShares Russell Mid-Cap Growth ETFIWP79.32M0.40%20.14B USD0.23%$141.14-0.23%Vanguard Morningstar Total Stock Market ETFVTIVanguard Morningstar Small-Cap ETFVBVanguard Morningstar Small-Cap Growth ETFVBKVanguard Extended Market ETFVXFGlobal X - U.S. Infrastructure Development ETFPAVEiShares Large Cap Core Active ETFBLCRState Street SPDR S&P MIDCAP 400 ETF TrustMDYiShares Russell Mid-Cap Growth ETFIWP
AI-generated and delayed market data for informational and educational purposes only. Not investment advice.