Loading

NYSEIndustrialsAerospace & Defense
Latest quote
$480.72
−$3.76 · -0.78%
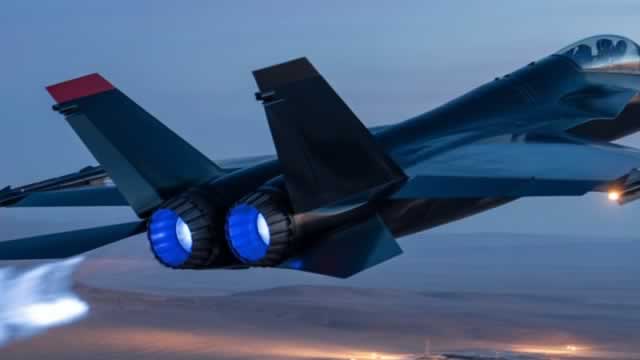
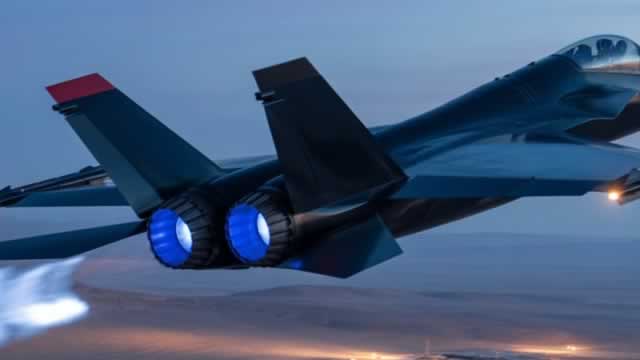
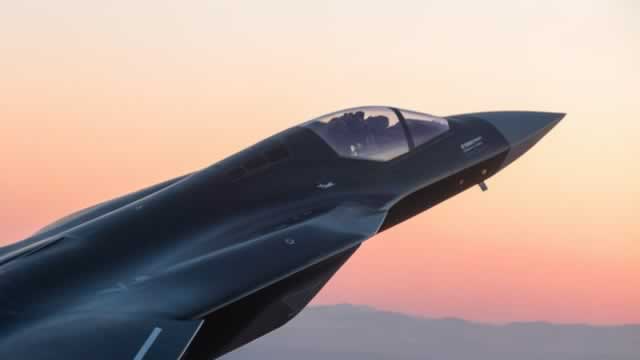
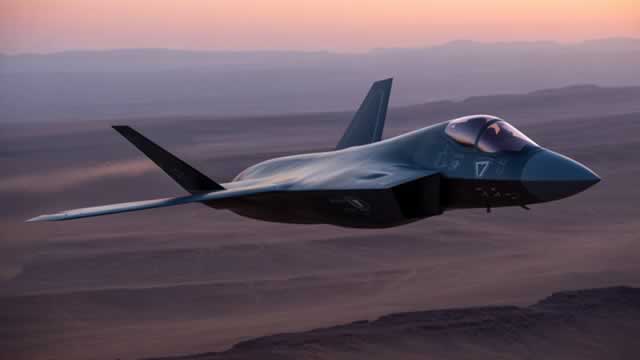
Northrop Grumman Corporation is a leading global player in the aerospace and defense sectors. Its Aeronautics Systems division is responsible for the full lifecycle of aircraft, from design and development to production, integration, and ongoing maintenance. This includes a diverse portfolio of crewed and uncrewed aerial platforms: advanced strategic long-range strike aircraft, tactical fighter and air superiority jets, and sophisticated airborne systems for battle management and command and control. Additionally, it specializes in autonomous uncrewed aircraft systems, such as high-altitude, long-endurance strategic intelligence, surveillance, and reconnaissance (ISR) platforms, alongside vertical take-off and landing tactical ISR systems. The Defense Systems segment focuses on creating and delivering a wide array of weapons and mission technologies. Its offerings encompass integrated battle management solutions, various weapons platforms, and specialized aircraft. Key products include command and control systems, munitions, and missiles, alongside precision strike capabilities. The segment is also at the forefront of propulsion technologies, offering both air-breathing and advanced hypersonic systems, as well as sophisticated gun systems and precision munitions. Beyond products, it provides comprehensive life-cycle support, including software services, ongoing maintenance, logistics, operational assistance, and modernization efforts for air, sea, and ground-based defense systems. Within its Mission Systems division, Northrop Grumman delivers critical capabilities spanning cybersecurity, C4ISR (command, control, communications, computers, intelligence, surveillance, and reconnaissance). This includes developing advanced sensing technologies such as radar, electro-optical/infrared, and acoustic sensors, alongside electronic warfare systems. The division also provides cutting-edge communications and networking solutions, intelligence processing, navigation systems, and maritime power, propulsion, and payload launch systems. Furthermore, it supplies airborne multifunction sensors, integrated maritime and land-based systems, targeting and survivability solutions, and robust networked information platforms. The Space Systems segment is a key provider of space-based solutions, delivering satellites and their associated payloads, along with essential ground control systems. It specializes in missile defense systems, including interceptors, and offers a range of launch vehicles with their propulsion components, as well as strategic missile technologies. Established in 1939, the corporation maintains its headquarters in Falls Church, Virginia.
Previous close
$480.72
−$3.76 · -0.78%
Regular session · ET · Market data may be delayed.
Northrop Grumman Corporation is a leading global player in the aerospace and defense sectors. Its Aeronautics Systems division is responsible for the full lifecycle of aircraft, from design and development to production, integration, and ongoing maintenance. This includes a diverse portfolio of crewed and uncrewed aerial platforms: advanced strategic long-range strike aircraft, tactical fighter and air superiority jets, and sophisticated airborne systems for battle management and command and control. Additionally, it specializes in autonomous uncrewed aircraft systems, such as high-altitude, long-endurance strategic intelligence, surveillance, and reconnaissance (ISR) platforms, alongside vertical take-off and landing tactical ISR systems. The Defense Systems segment focuses on creating and delivering a wide array of weapons and mission technologies. Its offerings encompass integrated battle management solutions, various weapons platforms, and specialized aircraft. Key products include command and control systems, munitions, and missiles, alongside precision strike capabilities. The segment is also at the forefront of propulsion technologies, offering both air-breathing and advanced hypersonic systems, as well as sophisticated gun systems and precision munitions. Beyond products, it provides comprehensive life-cycle support, including software services, ongoing maintenance, logistics, operational assistance, and modernization efforts for air, sea, and ground-based defense systems. Within its Mission Systems division, Northrop Grumman delivers critical capabilities spanning cybersecurity, C4ISR (command, control, communications, computers, intelligence, surveillance, and reconnaissance). This includes developing advanced sensing technologies such as radar, electro-optical/infrared, and acoustic sensors, alongside electronic warfare systems. The division also provides cutting-edge communications and networking solutions, intelligence processing, navigation systems, and maritime power, propulsion, and payload launch systems. Furthermore, it supplies airborne multifunction sensors, integrated maritime and land-based systems, targeting and survivability solutions, and robust networked information platforms. The Space Systems segment is a key provider of space-based solutions, delivering satellites and their associated payloads, along with essential ground control systems. It specializes in missile defense systems, including interceptors, and offers a range of launch vehicles with their propulsion components, as well as strategic missile technologies. Established in 1939, the corporation maintains its headquarters in Falls Church, Virginia.
Day range
Current $480.72
52-week range
Current $480.72
Regular session · ET · Market data may be delayed.
GoAI Score
Buy
Valuation
100
Deep Value
Sentiment
72
Bullish
Risk
33
Moderate Risk
Momentum
38
Weakening
Full GoAI research
Thesis, catalysts, evidence, and risk analysis.
Northrop Grumman Corporation is a leading global player in the aerospace and defense sectors. Its Aeronautics Systems division is responsible for the full lifecycle of aircraft, from design and development to production, integration, and ongoing maintenance. This includes a diverse portfolio of crewed and uncrewed aerial platforms: advanced strategic long-range strike aircraft, tactical fighter and air superiority jets, and sophisticated airborne systems for battle management and command and control. Additionally, it specializes in autonomous uncrewed aircraft systems, such as high-altitude, long-endurance strategic intelligence, surveillance, and reconnaissance (ISR) platforms, alongside vertical take-off and landing tactical ISR systems. The Defense Systems segment focuses on creating and delivering a wide array of weapons and mission technologies. Its offerings encompass integrated battle management solutions, various weapons platforms, and specialized aircraft. Key products include command and control systems, munitions, and missiles, alongside precision strike capabilities. The segment is also at the forefront of propulsion technologies, offering both air-breathing and advanced hypersonic systems, as well as sophisticated gun systems and precision munitions. Beyond products, it provides comprehensive life-cycle support, including software services, ongoing maintenance, logistics, operational assistance, and modernization efforts for air, sea, and ground-based defense systems. Within its Mission Systems division, Northrop Grumman delivers critical capabilities spanning cybersecurity, C4ISR (command, control, communications, computers, intelligence, surveillance, and reconnaissance). This includes developing advanced sensing technologies such as radar, electro-optical/infrared, and acoustic sensors, alongside electronic warfare systems. The division also provides cutting-edge communications and networking solutions, intelligence processing, navigation systems, and maritime power, propulsion, and payload launch systems. Furthermore, it supplies airborne multifunction sensors, integrated maritime and land-based systems, targeting and survivability solutions, and robust networked information platforms. The Space Systems segment is a key provider of space-based solutions, delivering satellites and their associated payloads, along with essential ground control systems. It specializes in missile defense systems, including interceptors, and offers a range of launch vehicles with their propulsion components, as well as strategic missile technologies. Established in 1939, the corporation maintains its headquarters in Falls Church, Virginia.
Day range
Current $480.72
52-week range
Current $480.72
Profitability as a percentage of reported revenue.
Revenue
Operating income
Net income
| Metric (USD) | FY2025 | FY2024 | FY2023 | FY2022 | FY2021 |
|---|---|---|---|---|---|
| Revenue | 41.95B USD | 41.03B USD | 39.29B USD | 36.6B USD | 35.67B USD |
| Cost of goods sold | 33.64B USD | 32.67B USD | 32.74B USD | 29.13B USD | 28.4B USD |
| Gross profit | 8.31B USD | 8.36B USD | 6.55B USD | 7.47B USD | 7.27B USD |
| Research and development | 1.1B USD | 1.1B USD | 1.2B USD | 1.2B USD | 1.1B USD |
| Selling, general, and administrative | 4.03B USD | 2.89B USD | 3.91B USD | 1.14B USD | 227M USD |
| Operating expenses | 4.03B USD | 3.99B USD | 4.01B USD | 3.87B USD | 1.62B USD |
| Interest expense | 665M USD | 621M USD | 545M USD | 506M USD | 556M USD |
| Depreciation and amortization | 1.47B USD | 1.37B USD | 1.34B USD | 1.34B USD | 1.24B USD |
| Operating income | 4.28B USD | 4.37B USD | 2.54B USD | 3.6B USD | 5.65B USD |
| Net income | 4.18B USD | 4.17B USD | 2.06B USD | 4.9B USD | 7.01B USD |
Company facts updated Oct 11, 2026.
Recent quarterly results
Recent quarterly results
Third-party consensus; not a GoAI recommendation.
Average target
$600.62
24.94% upsideCash distributions grouped by calendar year; partial years are marked.
$8.99
2025 complete year+45.9% since 2021
2026 partial: $7.25
$6.16
2,021
$6.76
2,022
$7.34
2,023
$8.05
2,024
$8.99
2,025
$7.25
2,026*
* Partial calendar year in the available dividend history.
| Action | Ex-dividend date | Details | Record date | Payment date |
|---|---|---|---|---|
Dividend | Aug 31, 2026 | $2.47Quarterly | Aug 31, 2026 | Sep 16, 2026 |
Dividend | Jun 1, 2026 | $2.47Quarterly | Jun 1, 2026 | Jun 17, 2026 |
Dividend | Feb 23, 2026 | $2.31Quarterly | Feb 23, 2026 | Mar 11, 2026 |
Dividend | Dec 1, 2025 | $2.31Quarterly | Dec 1, 2025 | Dec 17, 2025 |
Dividend | Sep 2, 2025 | $2.31Quarterly | Sep 2, 2025 | Sep 17, 2025 |
Dividend | Jun 2, 2025 | $2.31Quarterly | Jun 2, 2025 | Jun 18, 2025 |
Ex-dividend Aug 31, 2026
$2.47
Quarterly
Record Aug 31, 2026 · Payment Sep 16, 2026
Ex-dividend Jun 1, 2026
$2.47
Quarterly
Record Jun 1, 2026 · Payment Jun 17, 2026
Ex-dividend Feb 23, 2026
$2.31
Quarterly
Record Feb 23, 2026 · Payment Mar 11, 2026
Ex-dividend Dec 1, 2025
$2.31
Quarterly
Record Dec 1, 2025 · Payment Dec 17, 2025
Ex-dividend Sep 2, 2025
$2.31
Quarterly
Record Sep 2, 2025 · Payment Sep 17, 2025
Ex-dividend Jun 2, 2025
$2.31
Quarterly
Record Jun 2, 2025 · Payment Jun 18, 2025
Funds reporting this stock among their holdings, ordered by reported position size.
 State Street SPDR S&P 500 ETF1557.T125.32B0.10%129.35T JPY0.09%¥122,850+0.12%
 Vanguard Morningstar Total Stock Market ETFVTI2.44B0.10%2.3T USD0.03%$381.94+0.63%
 Vanguard S&P 500 ETFVOO1.91B0.11%1.8T USD0.03%$715.59+0.61%
 iShares Core S&P 500 ETFIVV859.89M0.10%896.44B USD0.03%$781.97+0.60%
 State Street SPDR S&P 500 ETFSPY791.7M0.10%817.2B USD0.09%$778.57+0.60%
 Vanguard Morningstar Value ETFVTV732.3M0.28%262.4B USD0.03%$220.59+0.44%
 iShares U.S. Aerospace & Defense ETFITA534.73M4.50%11.99B USD0.37%$206.65+0.86%
 Global X - Defense Tech ETFSHLD475.23M7.51%6.34B USD0.50%$59.87+1.15%State Street SPDR S&P 500 ETF1557.TVanguard Morningstar Total Stock Market ETFVTIVanguard S&P 500 ETFVOOiShares Core S&P 500 ETFIVVState Street SPDR S&P 500 ETFSPYVanguard Morningstar Value ETFVTViShares U.S. Aerospace & Defense ETFITAGlobal X - Defense Tech ETFSHLD
AI-generated and delayed market data for informational and educational purposes only. Not investment advice.